Selected workObservability

Aspen Mesh

Aspen Mesh built a service mesh for teams running microservices on Kubernetes and Istio. I designed its observability console and took it from annotated wireframes to a working HTML prototype, empty states included.

Role
Design Technologist
Years
2019 to 2021
Users
Platform and SRE teams
I made
IA, wireframes, coded prototype
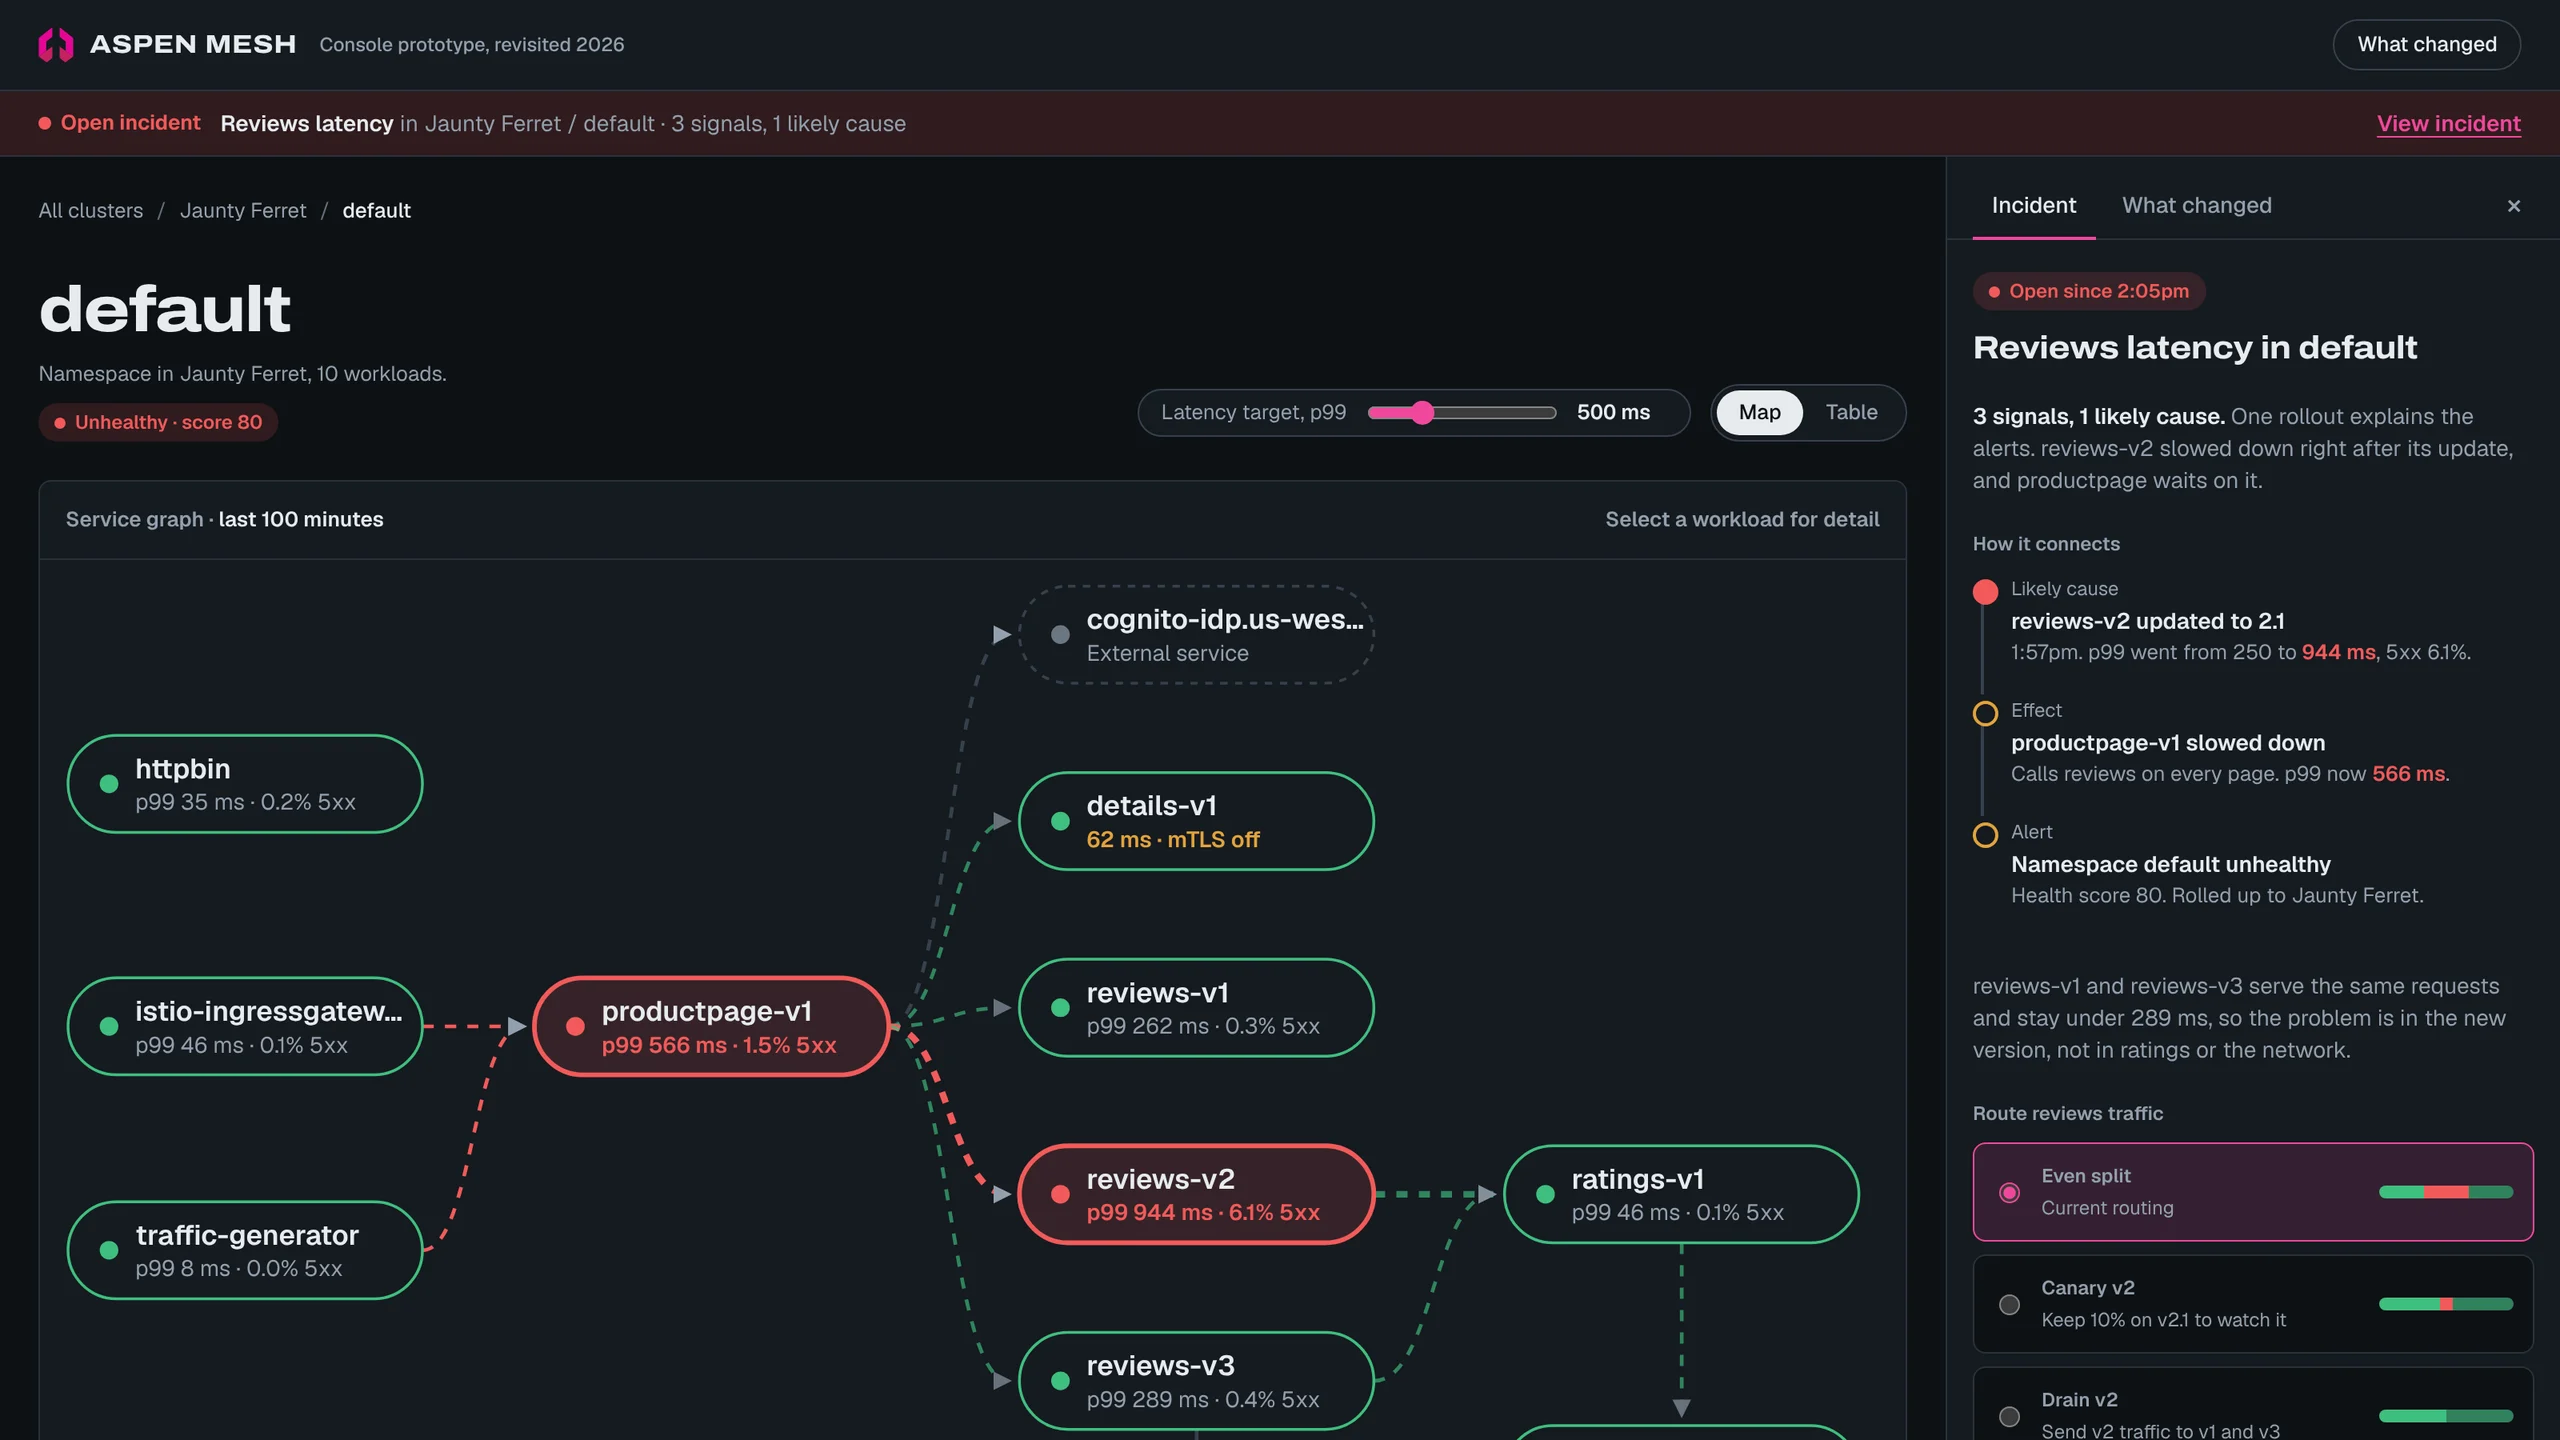
2026 rebuild of the console: the default namespace graph with productpage-v1 and reviews-v2 in red, and an incident panel explaining that the reviews-v2 update to 2.1 is the likely cause.2026 revisit
The console, rebuilt in 2026. Three alerts become one incident, traced back to the reviews-v2 rollout, with ways to route traffic around it in the same panel.

The problem

A service mesh adds a layer of traffic, security and policy between every service in a cluster. When something breaks, an operator has to work out which cluster, which namespace and which workload is at fault, and whether the mesh caused it.

The existing tools showed everything at once. The job was to make the first unhealthy thing obvious and keep the path to its cause short.
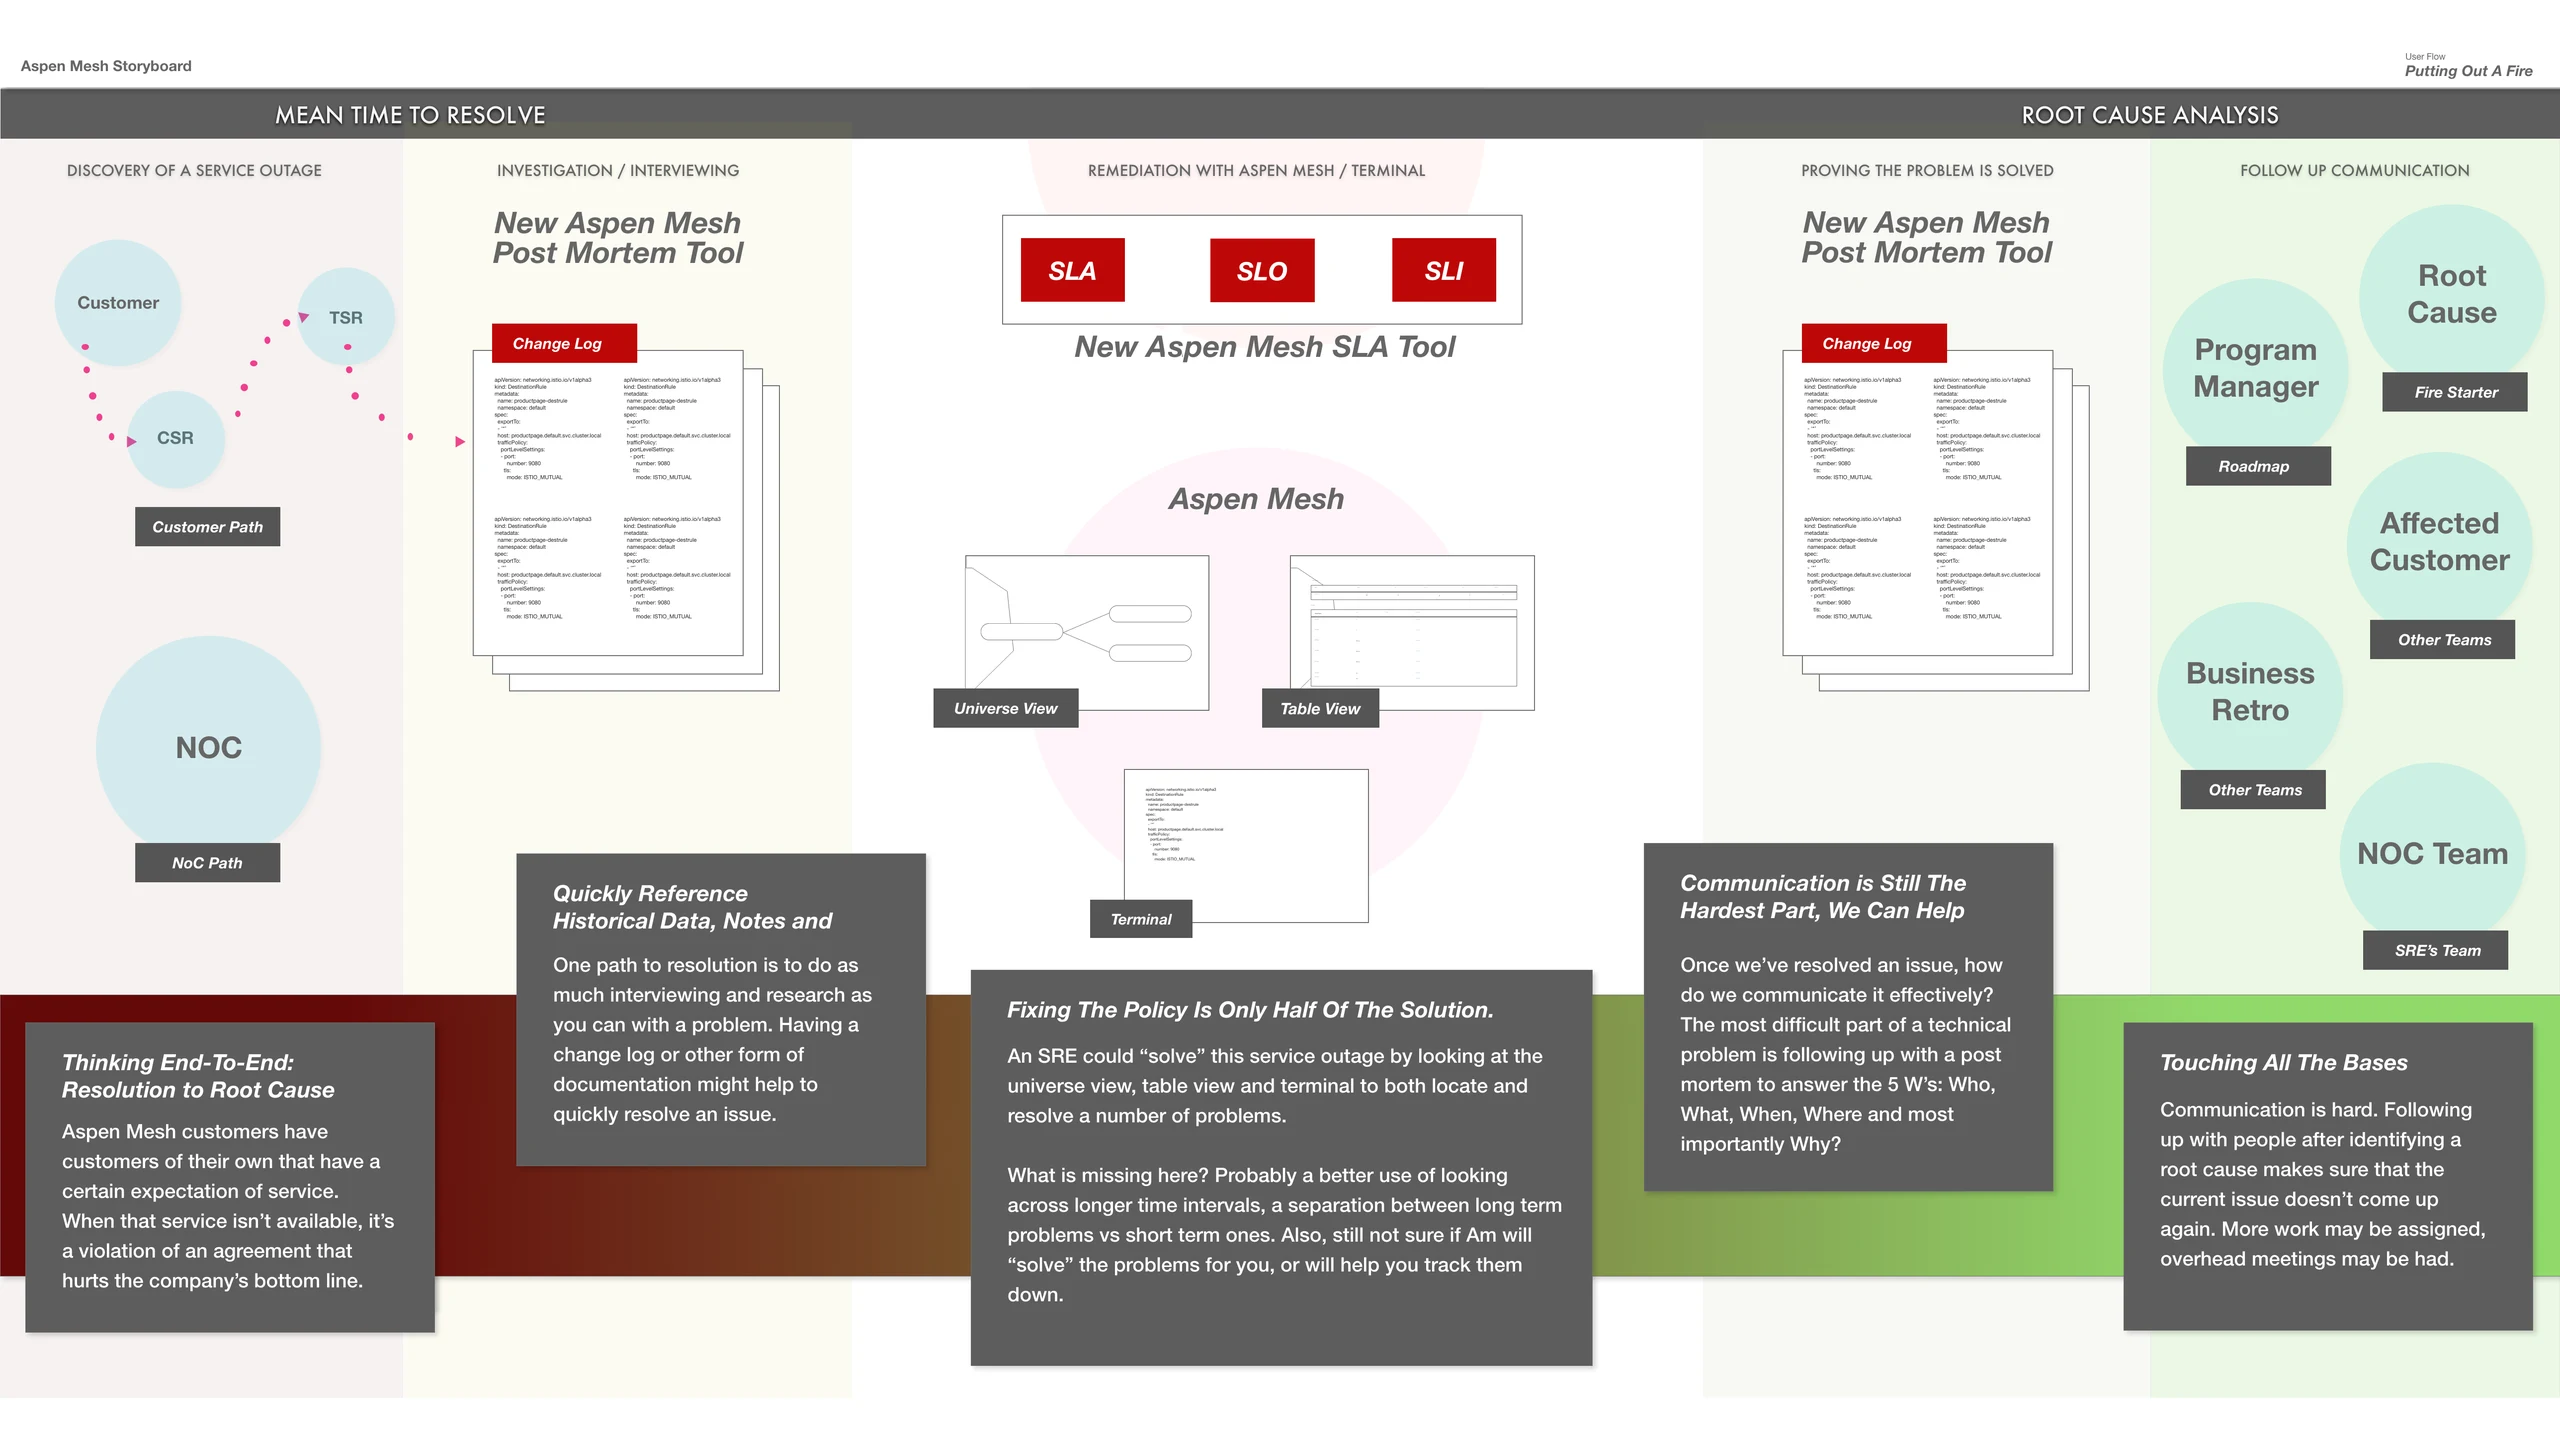
Storyboard titled Putting Out A Fire, running from discovery of a service outage through investigation, remediation, proving the fix and follow-up communication.Storyboard
Putting out a fire. The storyboard I drew first, from discovering an outage to root cause and the follow-up with every team involved.

Structure

I organized the console around the hierarchy operators already think in. Each level answers the same question, “is this healthy?”, and hands you to the level below.

  1. All clusters
  2. Cluster
  3. Namespace
  4. Workload

Health scores roll up through every level. Tracing, SLO settings, mTLS and config checks attach to the level where an operator would act on them.
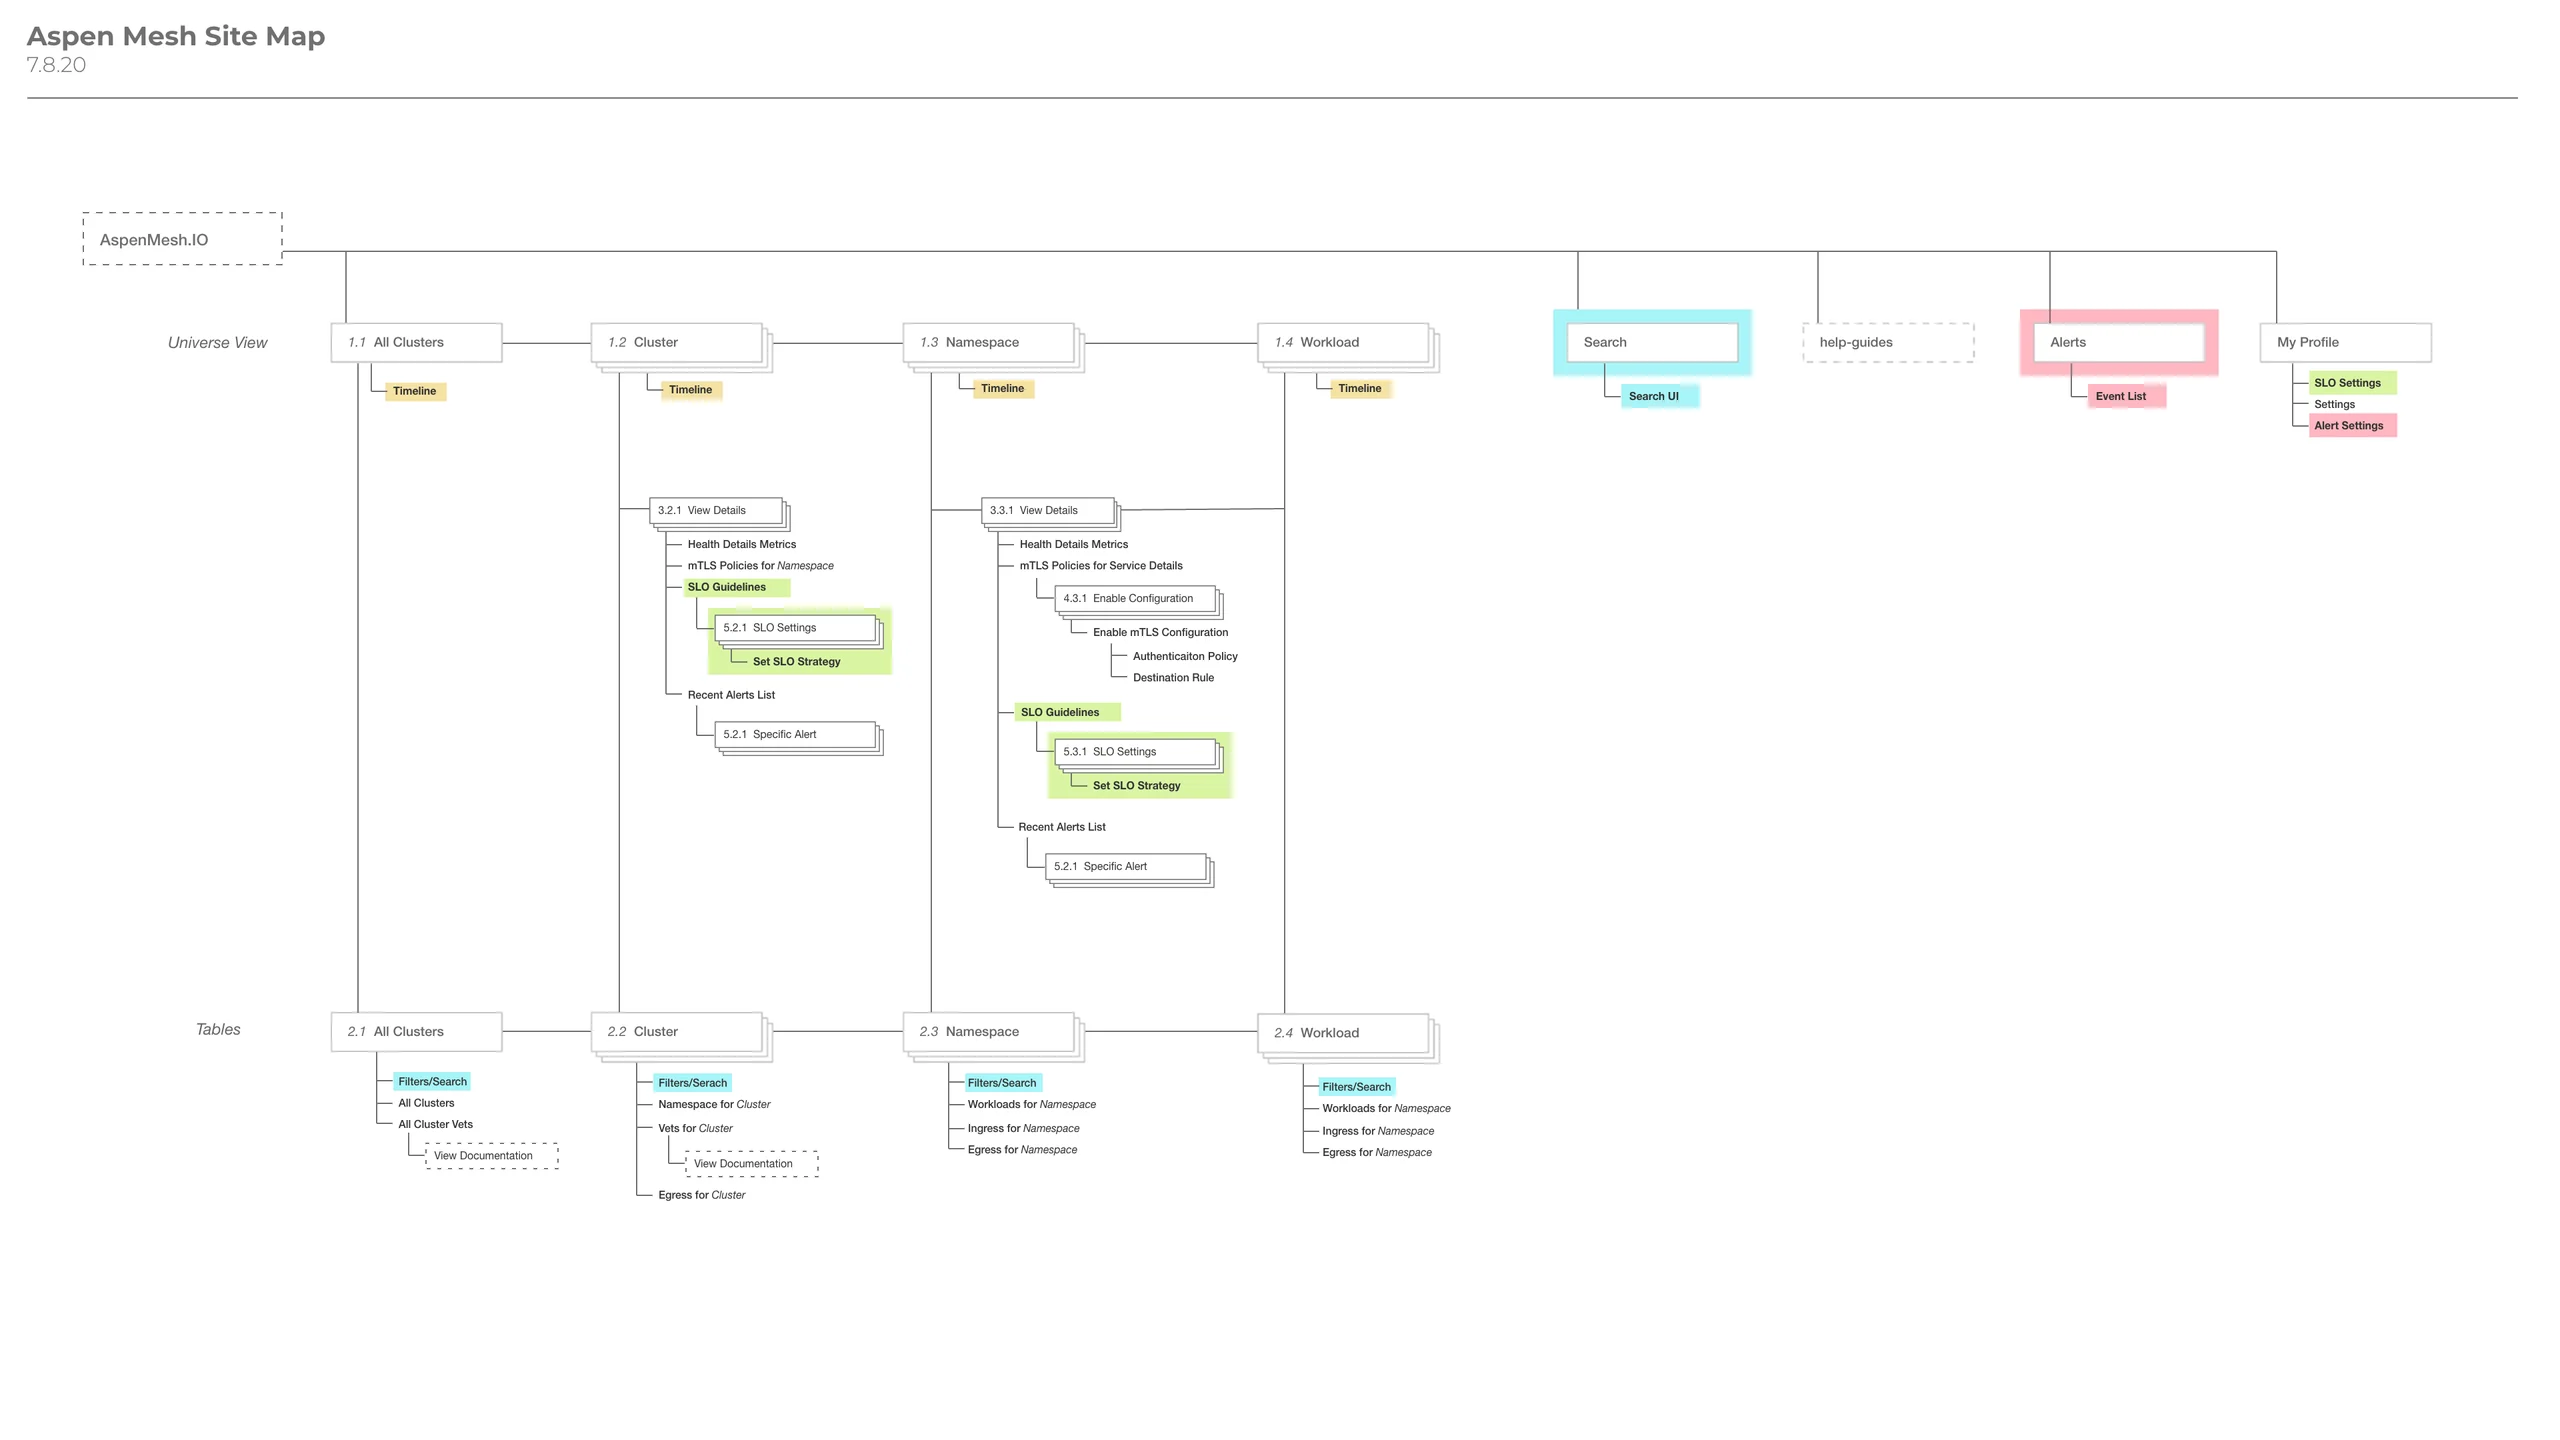
Sitemap showing All Clusters, Cluster, Namespace and Workload, mapped once for the visual Universe view and once for the data tables.Sitemap
Sitemap. The four levels, mapped twice: once for the visual view and once for the data tables.

Critiquing in the canvas

I wrote review notes directly onto the wireframes so the team could argue with the reasoning, not just the pixels. Two from the November 2019 set:

Naming
“‘All Clusters’ is unique in this language. Propose to just follow the nomenclature of Namespace page.”

2.1 All Clusters wireframe

Purpose
“A successful design should answer ‘why am I here’ without any verbal prompting.”

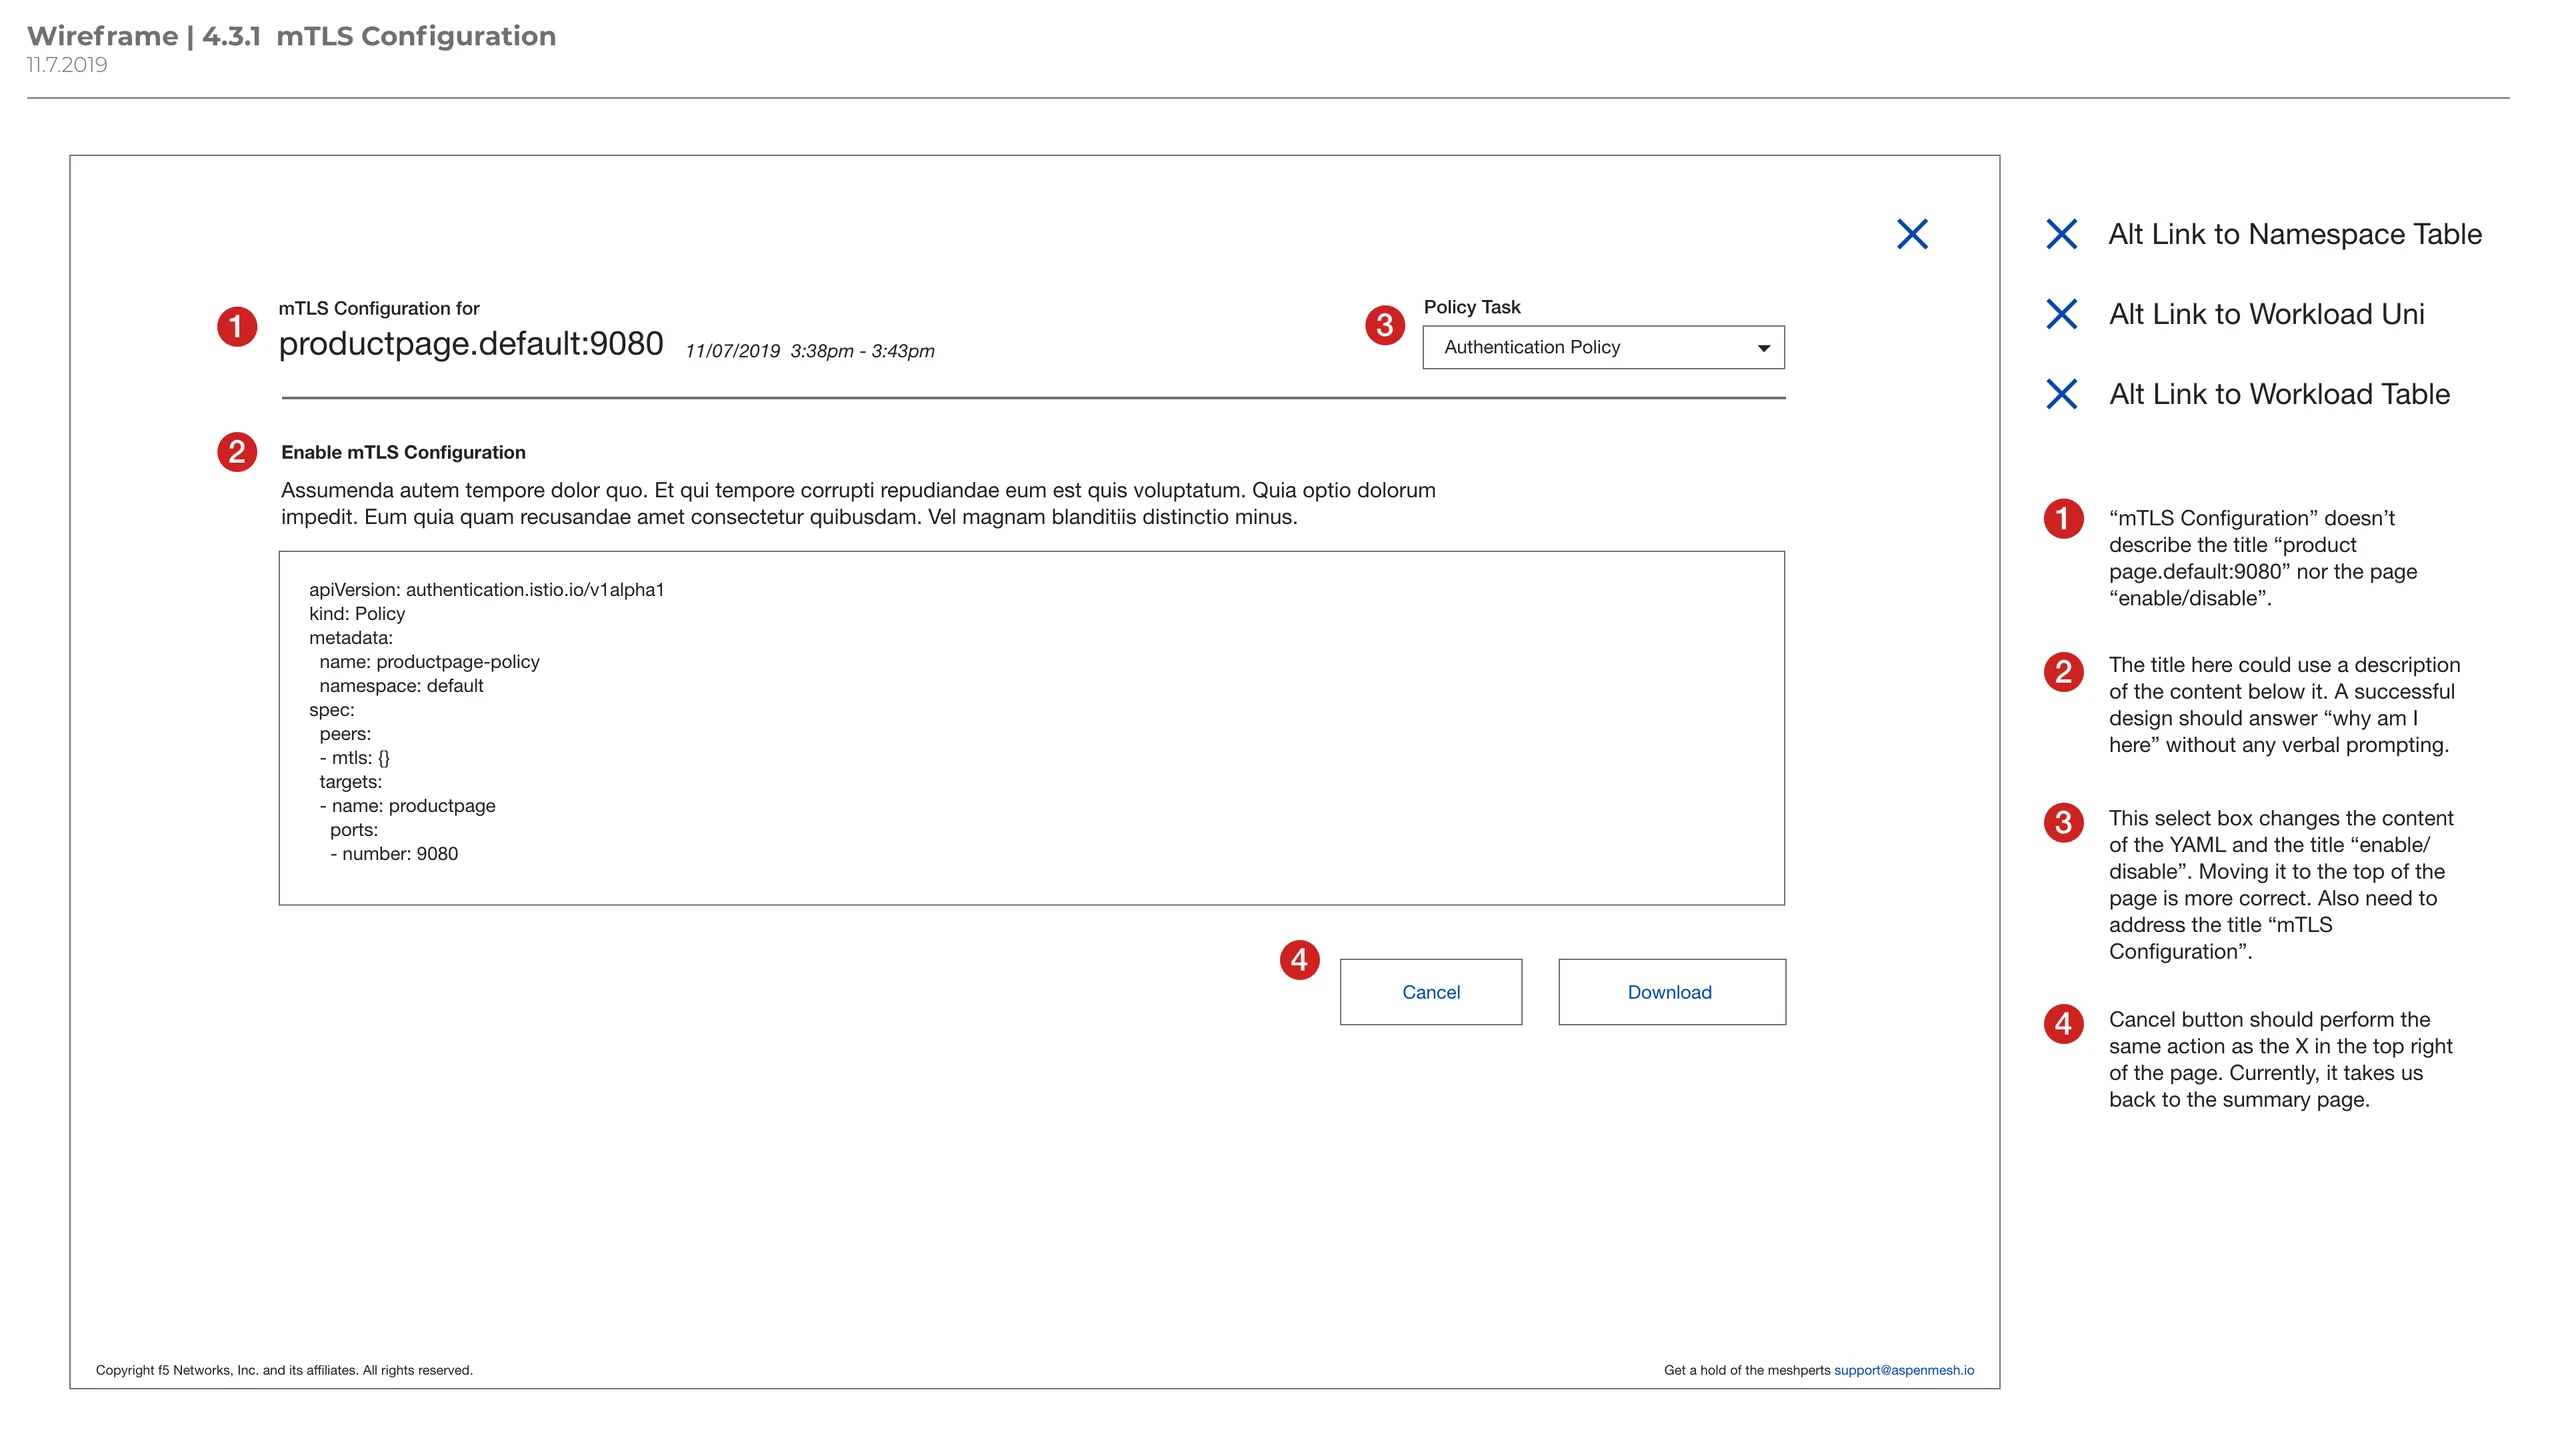
4.3.1 mTLS Configuration wireframe
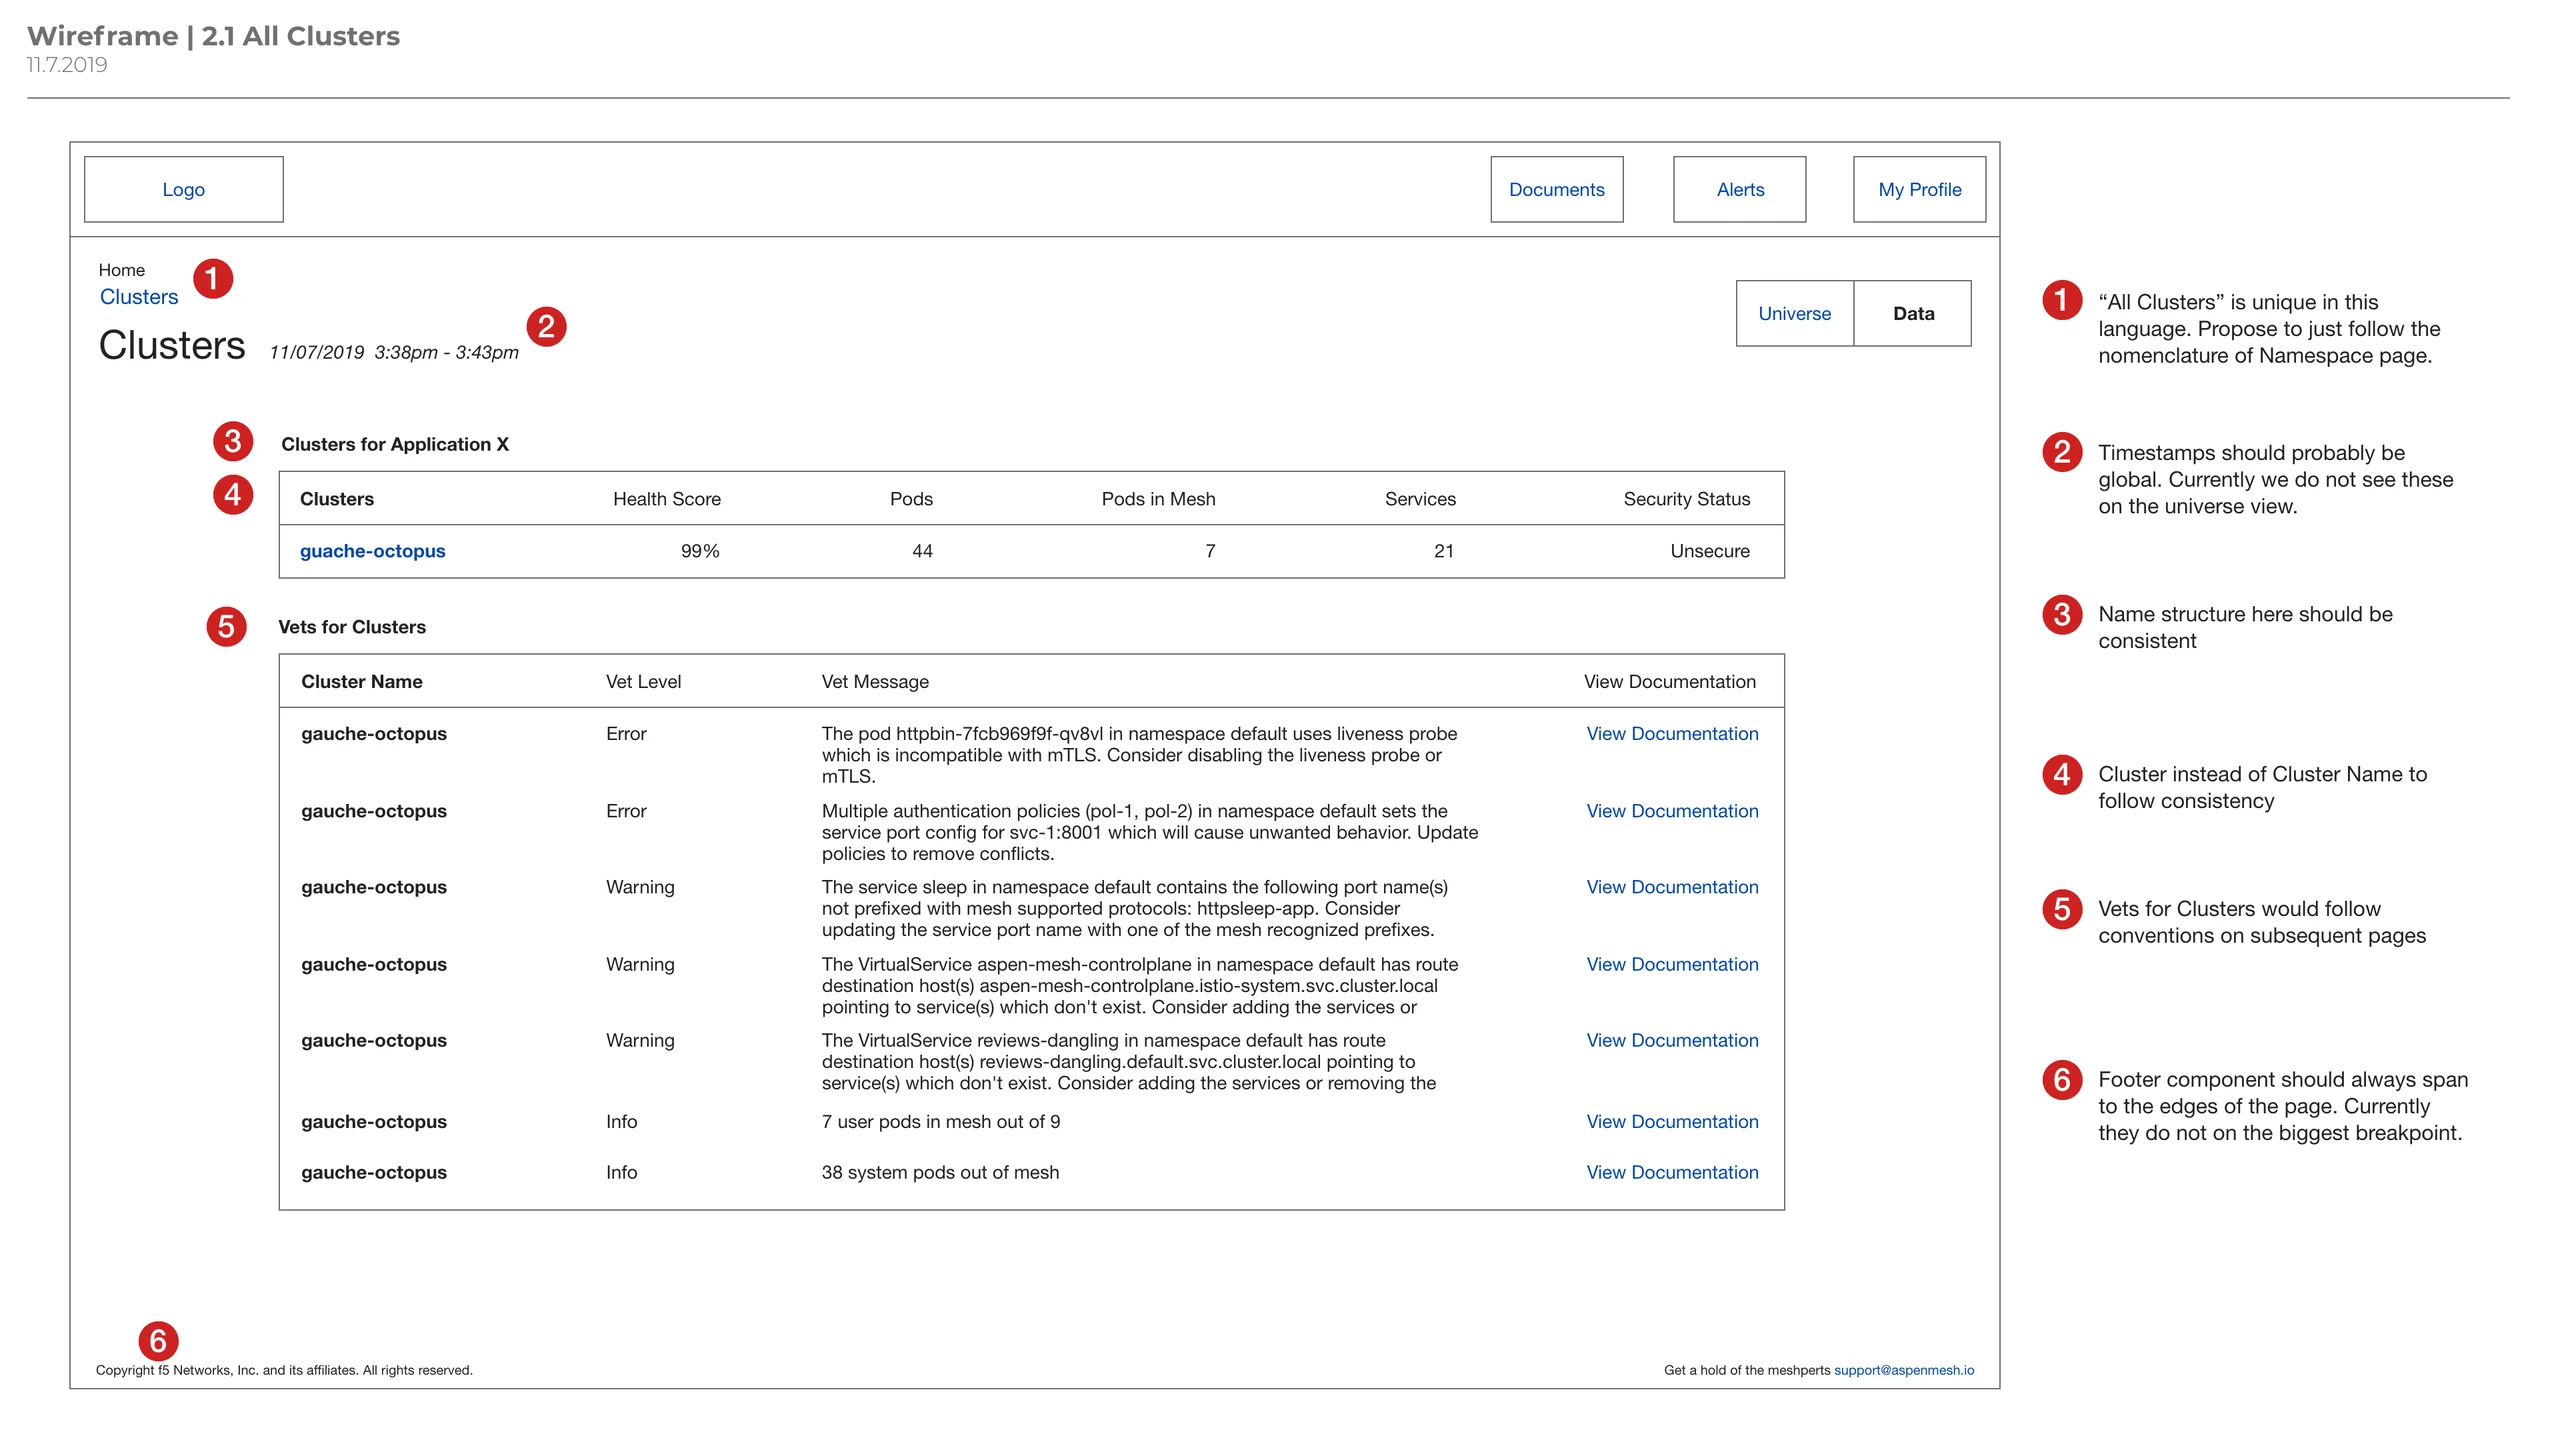
All Clusters wireframe with six numbered red markers and matching review notes in the right margin.Wireframe
All Clusters. Six numbered notes on naming, timestamps and layout consistency.
mTLS Configuration wireframe with four numbered review notes about the title, the policy selector and the Cancel button.Wireframe
mTLS configuration. Notes on titles that explain the page and controls that behave the same way.

Building it

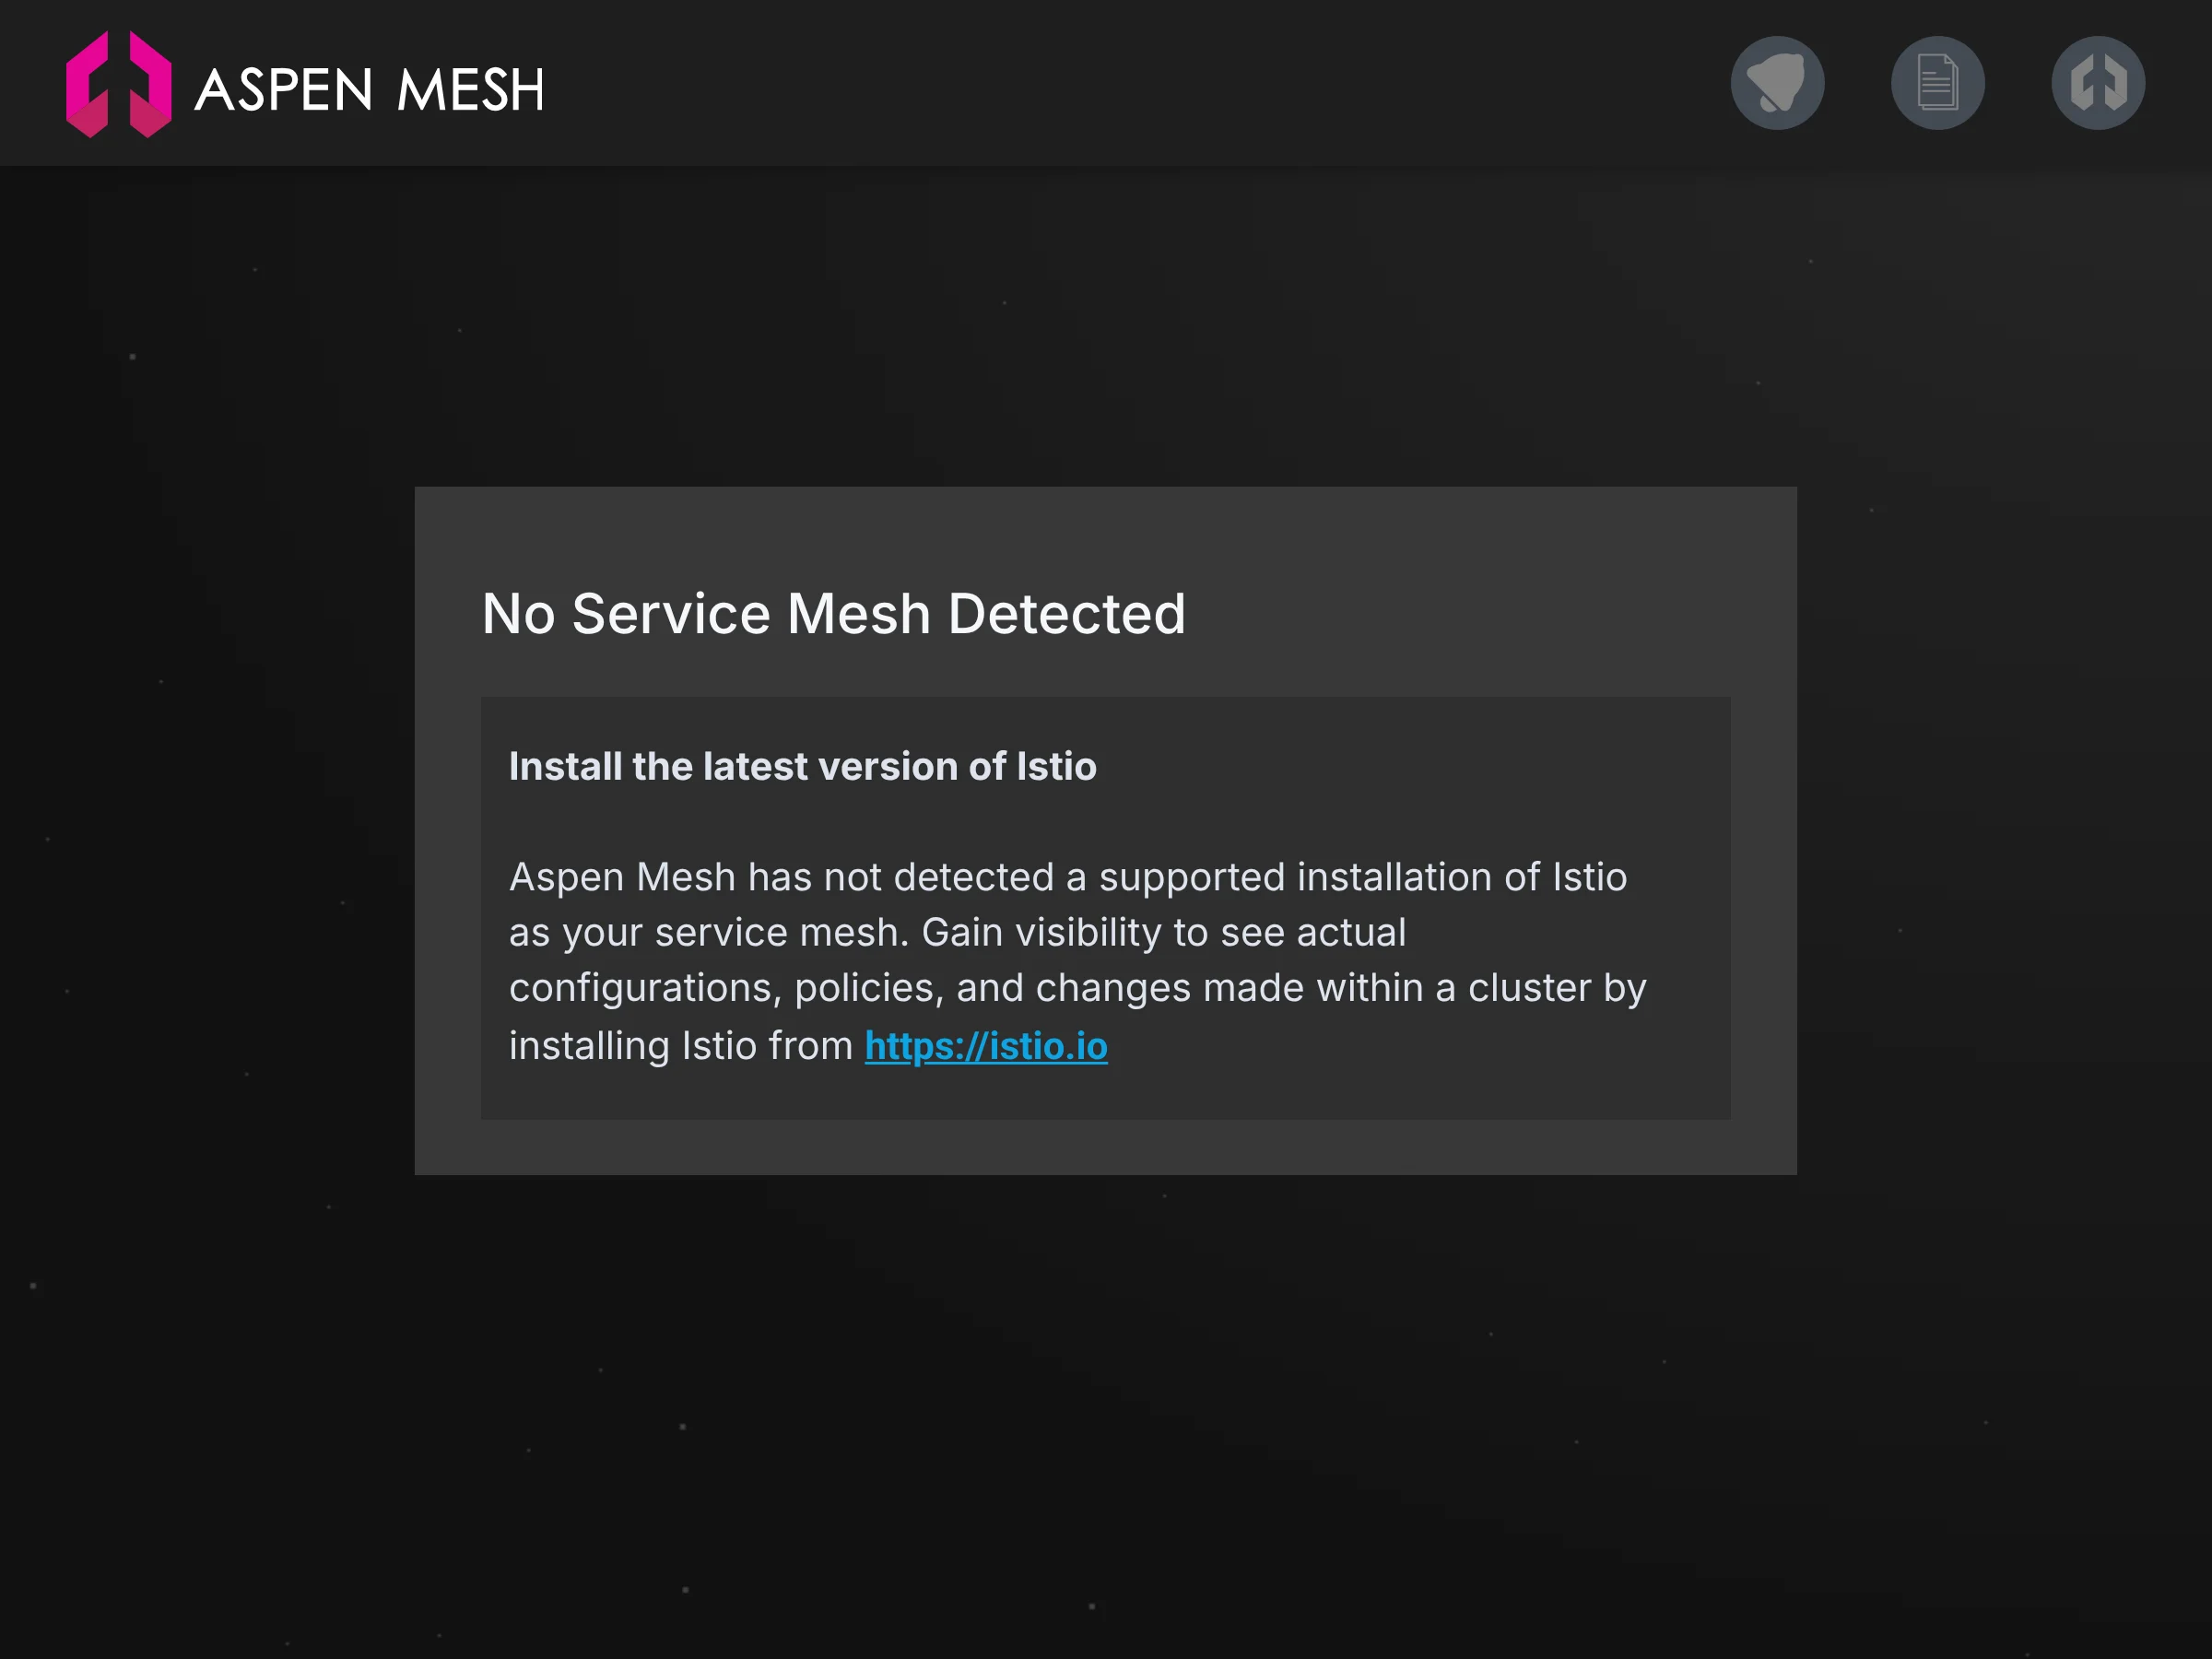
I then built the console as a hand-coded HTML prototype so the team could click through real flows. That meant designing the states wireframes skip, like a cluster with no mesh installed and alerts that need an action.

24Annotated wireframes
17Coded prototype pages
4Levels of drill‑down

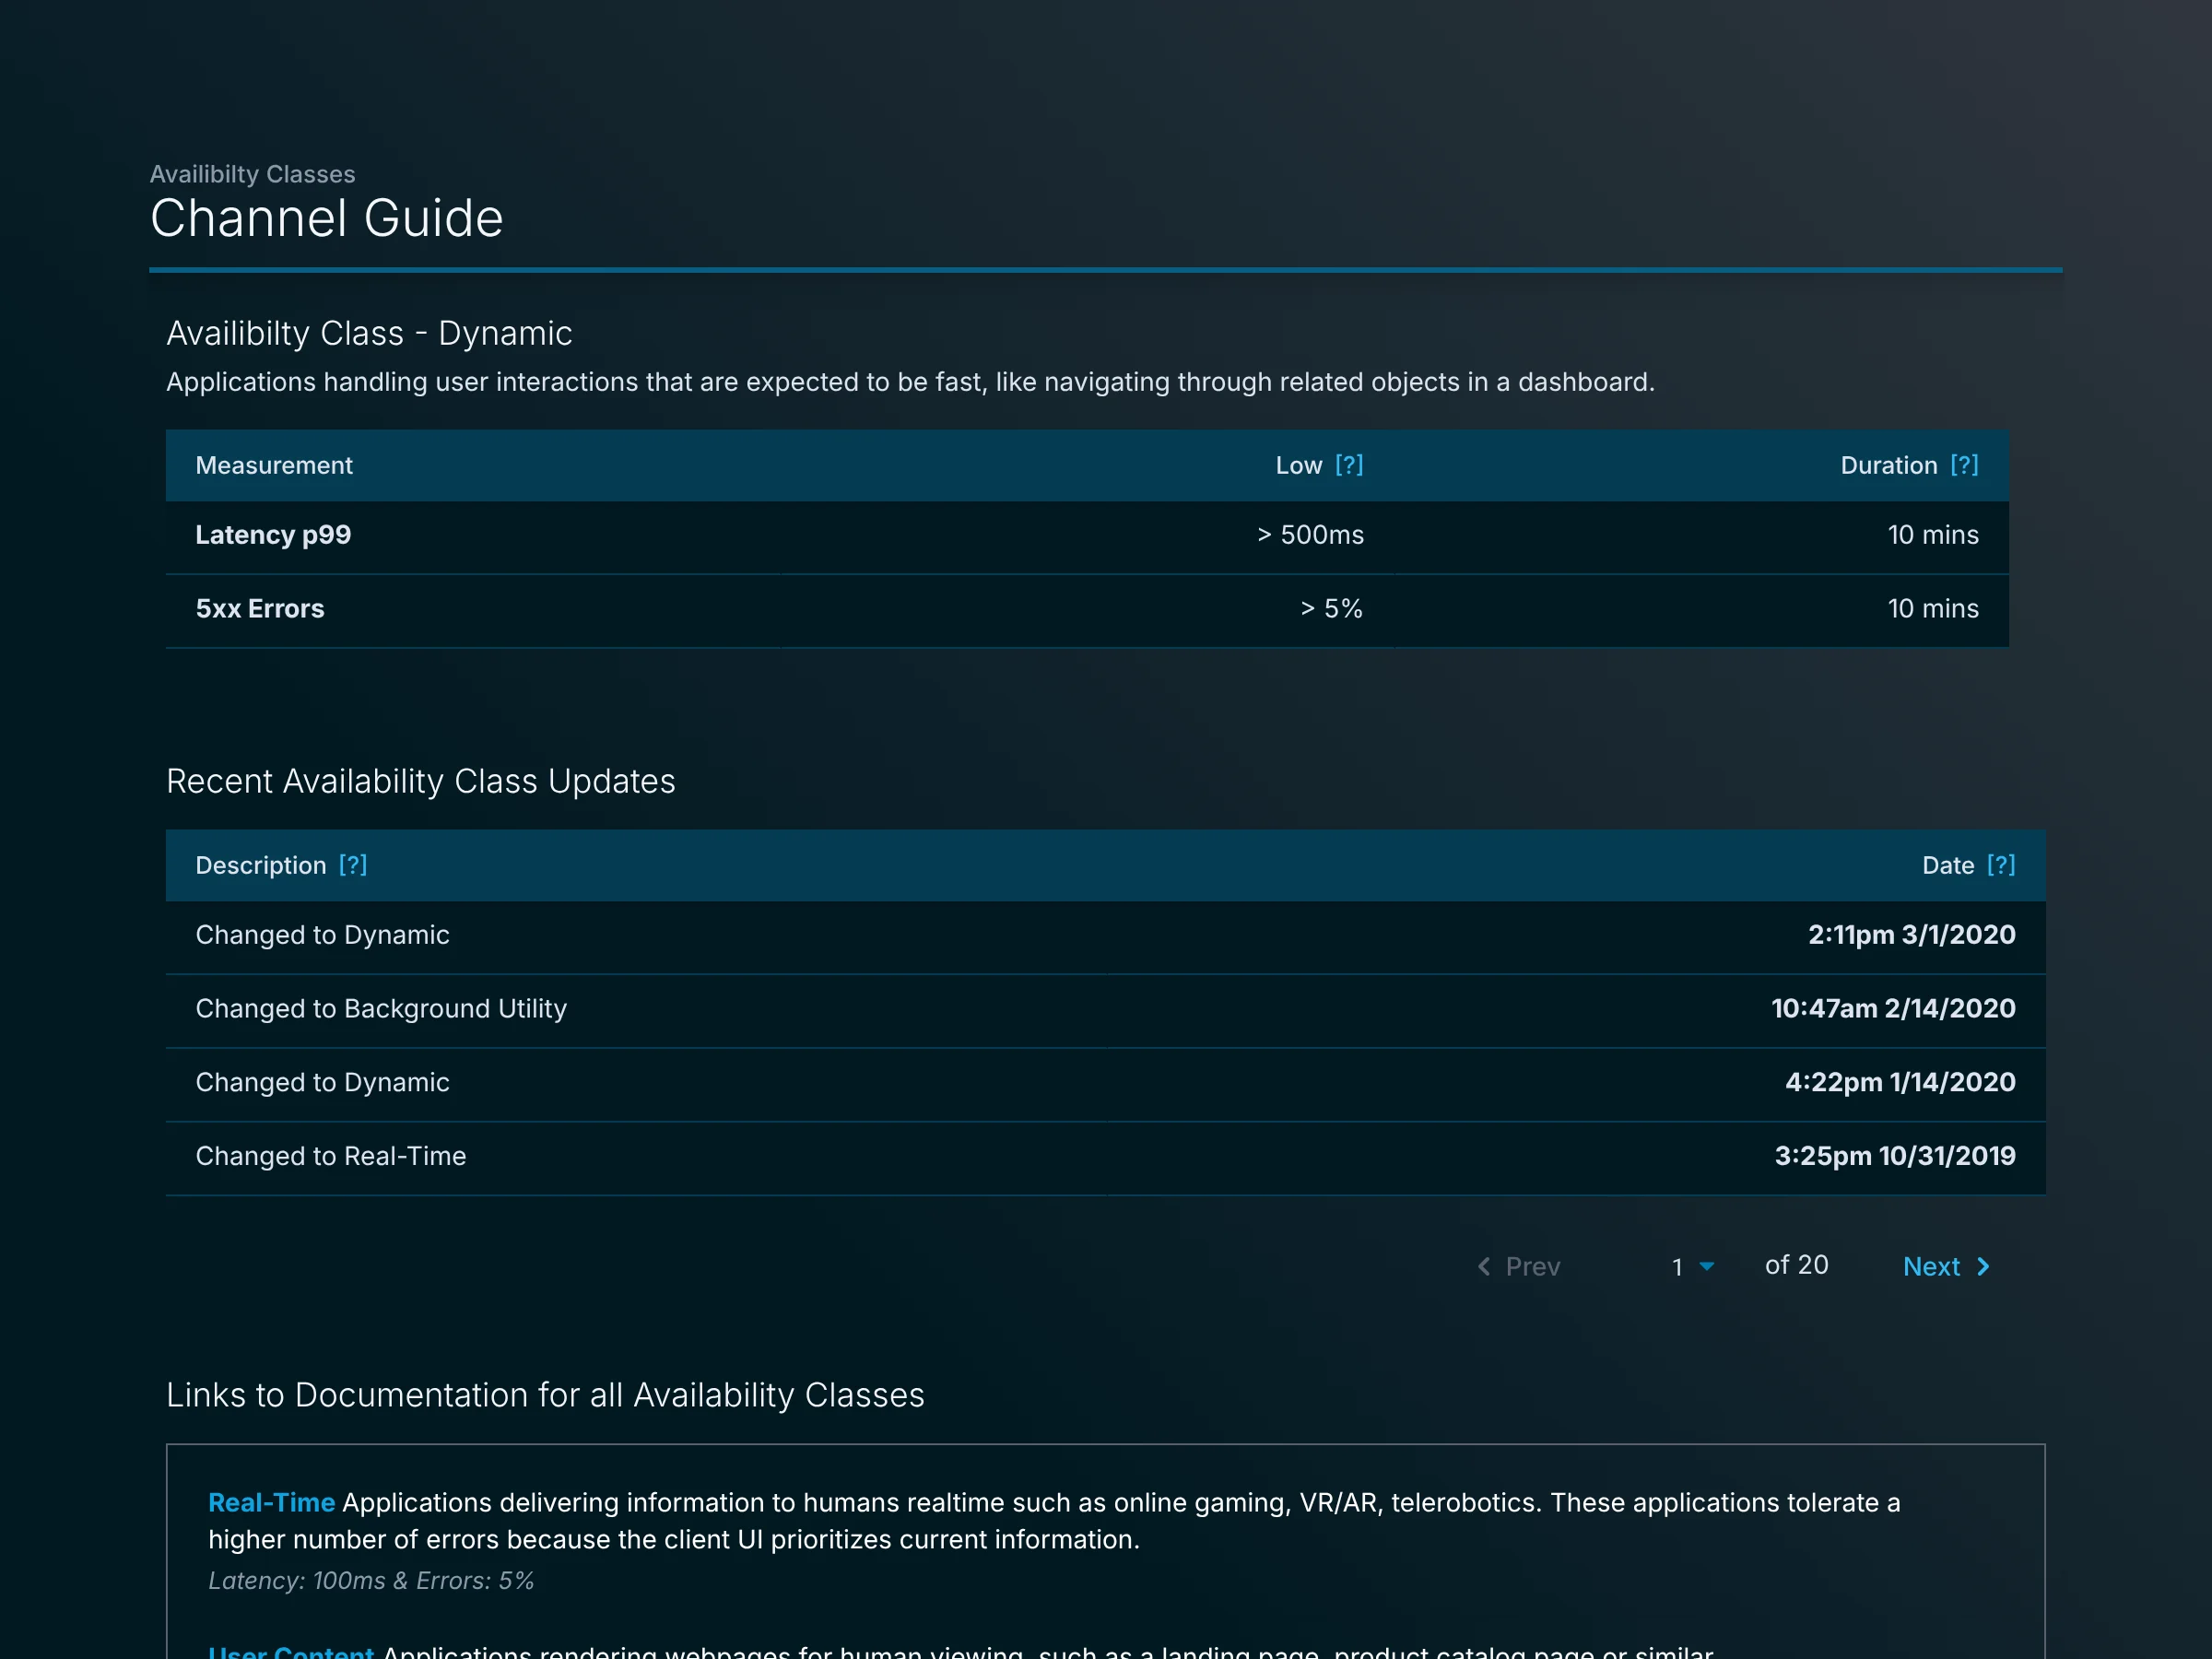
The prototype included a custom chart component, a health-trend indicator in every table, and availability classes that set the latency and error thresholds deciding when a service turns red.
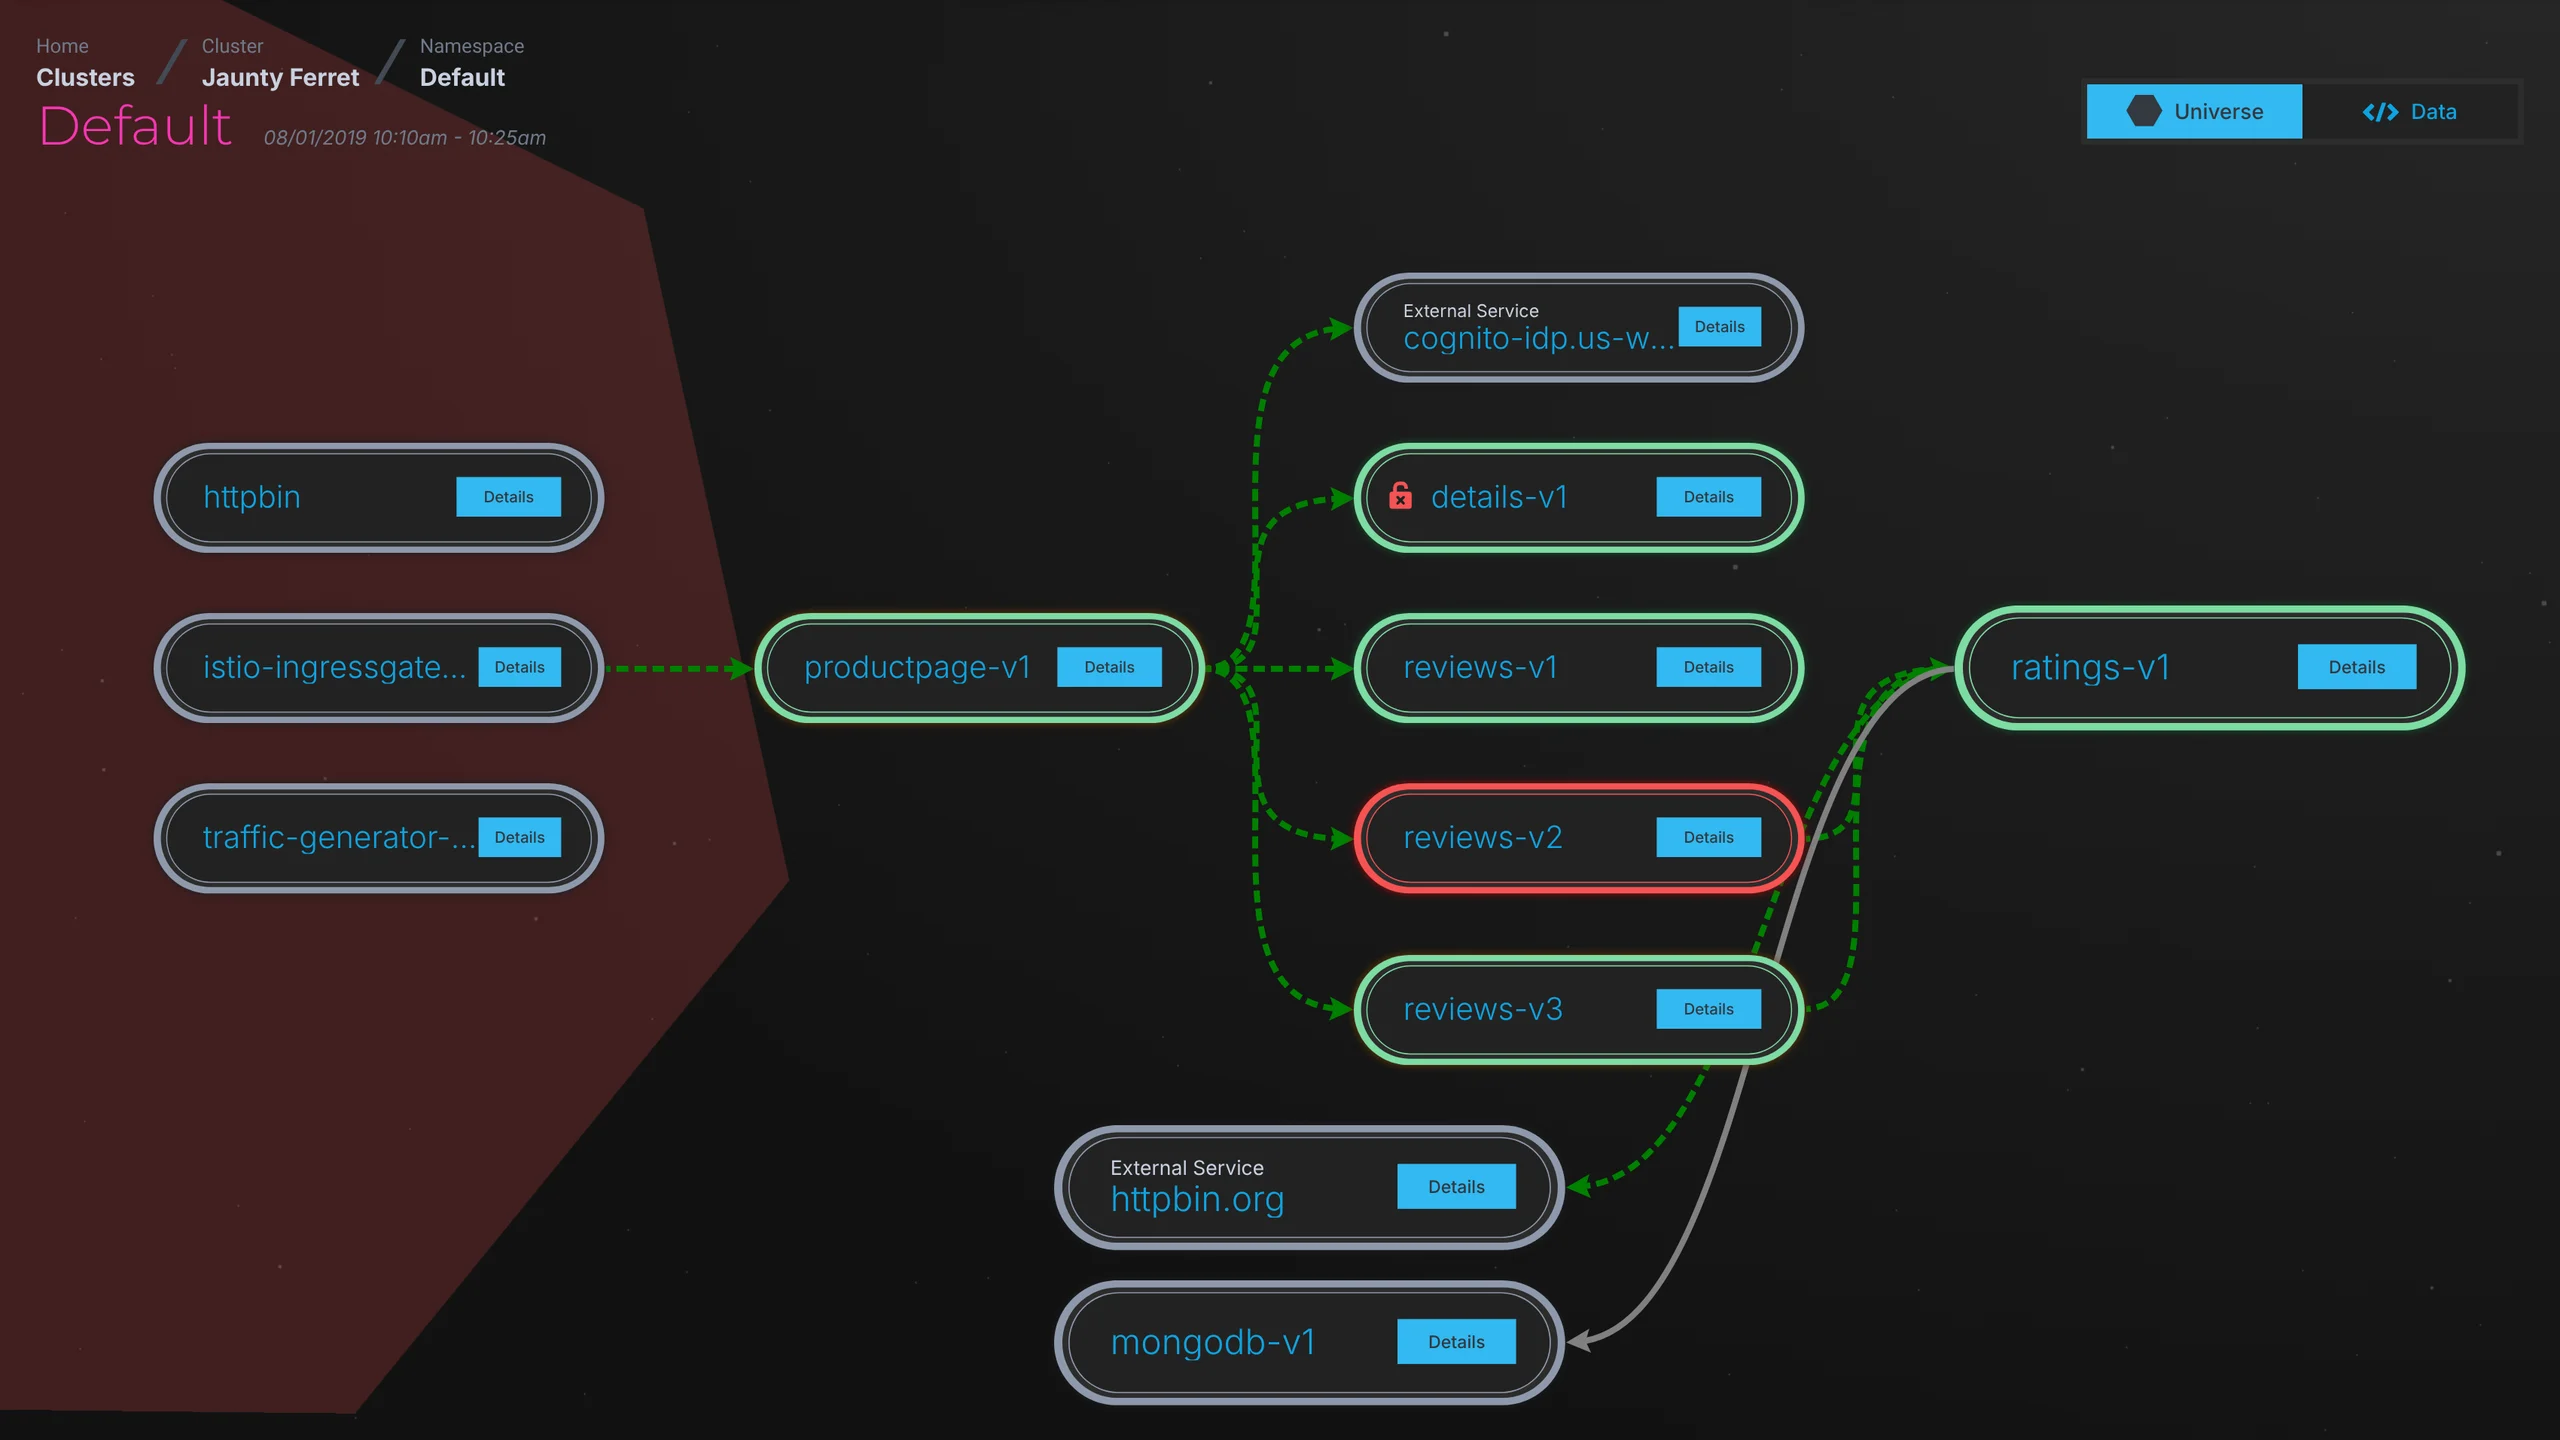
Service graph for the Default namespace of a cluster named Jaunty Ferret. Workloads are drawn as pills joined by traffic arrows; reviews-v2 is outlined in red as unhealthy.2019 build
Namespace service graph, 2019 build. Every workload in the namespace and the traffic between them. The one unhealthy service, reviews-v2, is outlined in red.
Built availability class page: the Dynamic class sets p99 latency above 500ms and 5xx errors above 5 percent over 10 minutes, followed by a history of class changes.2019 build
Availability classes, built. Each class sets latency and error thresholds for a service, with a history of every change.
Empty state reading No Service Mesh Detected, with instructions to install the latest version of Istio.2019 build
No mesh installed. The empty state tells you what to install and where to get it.

Revisited in 2026

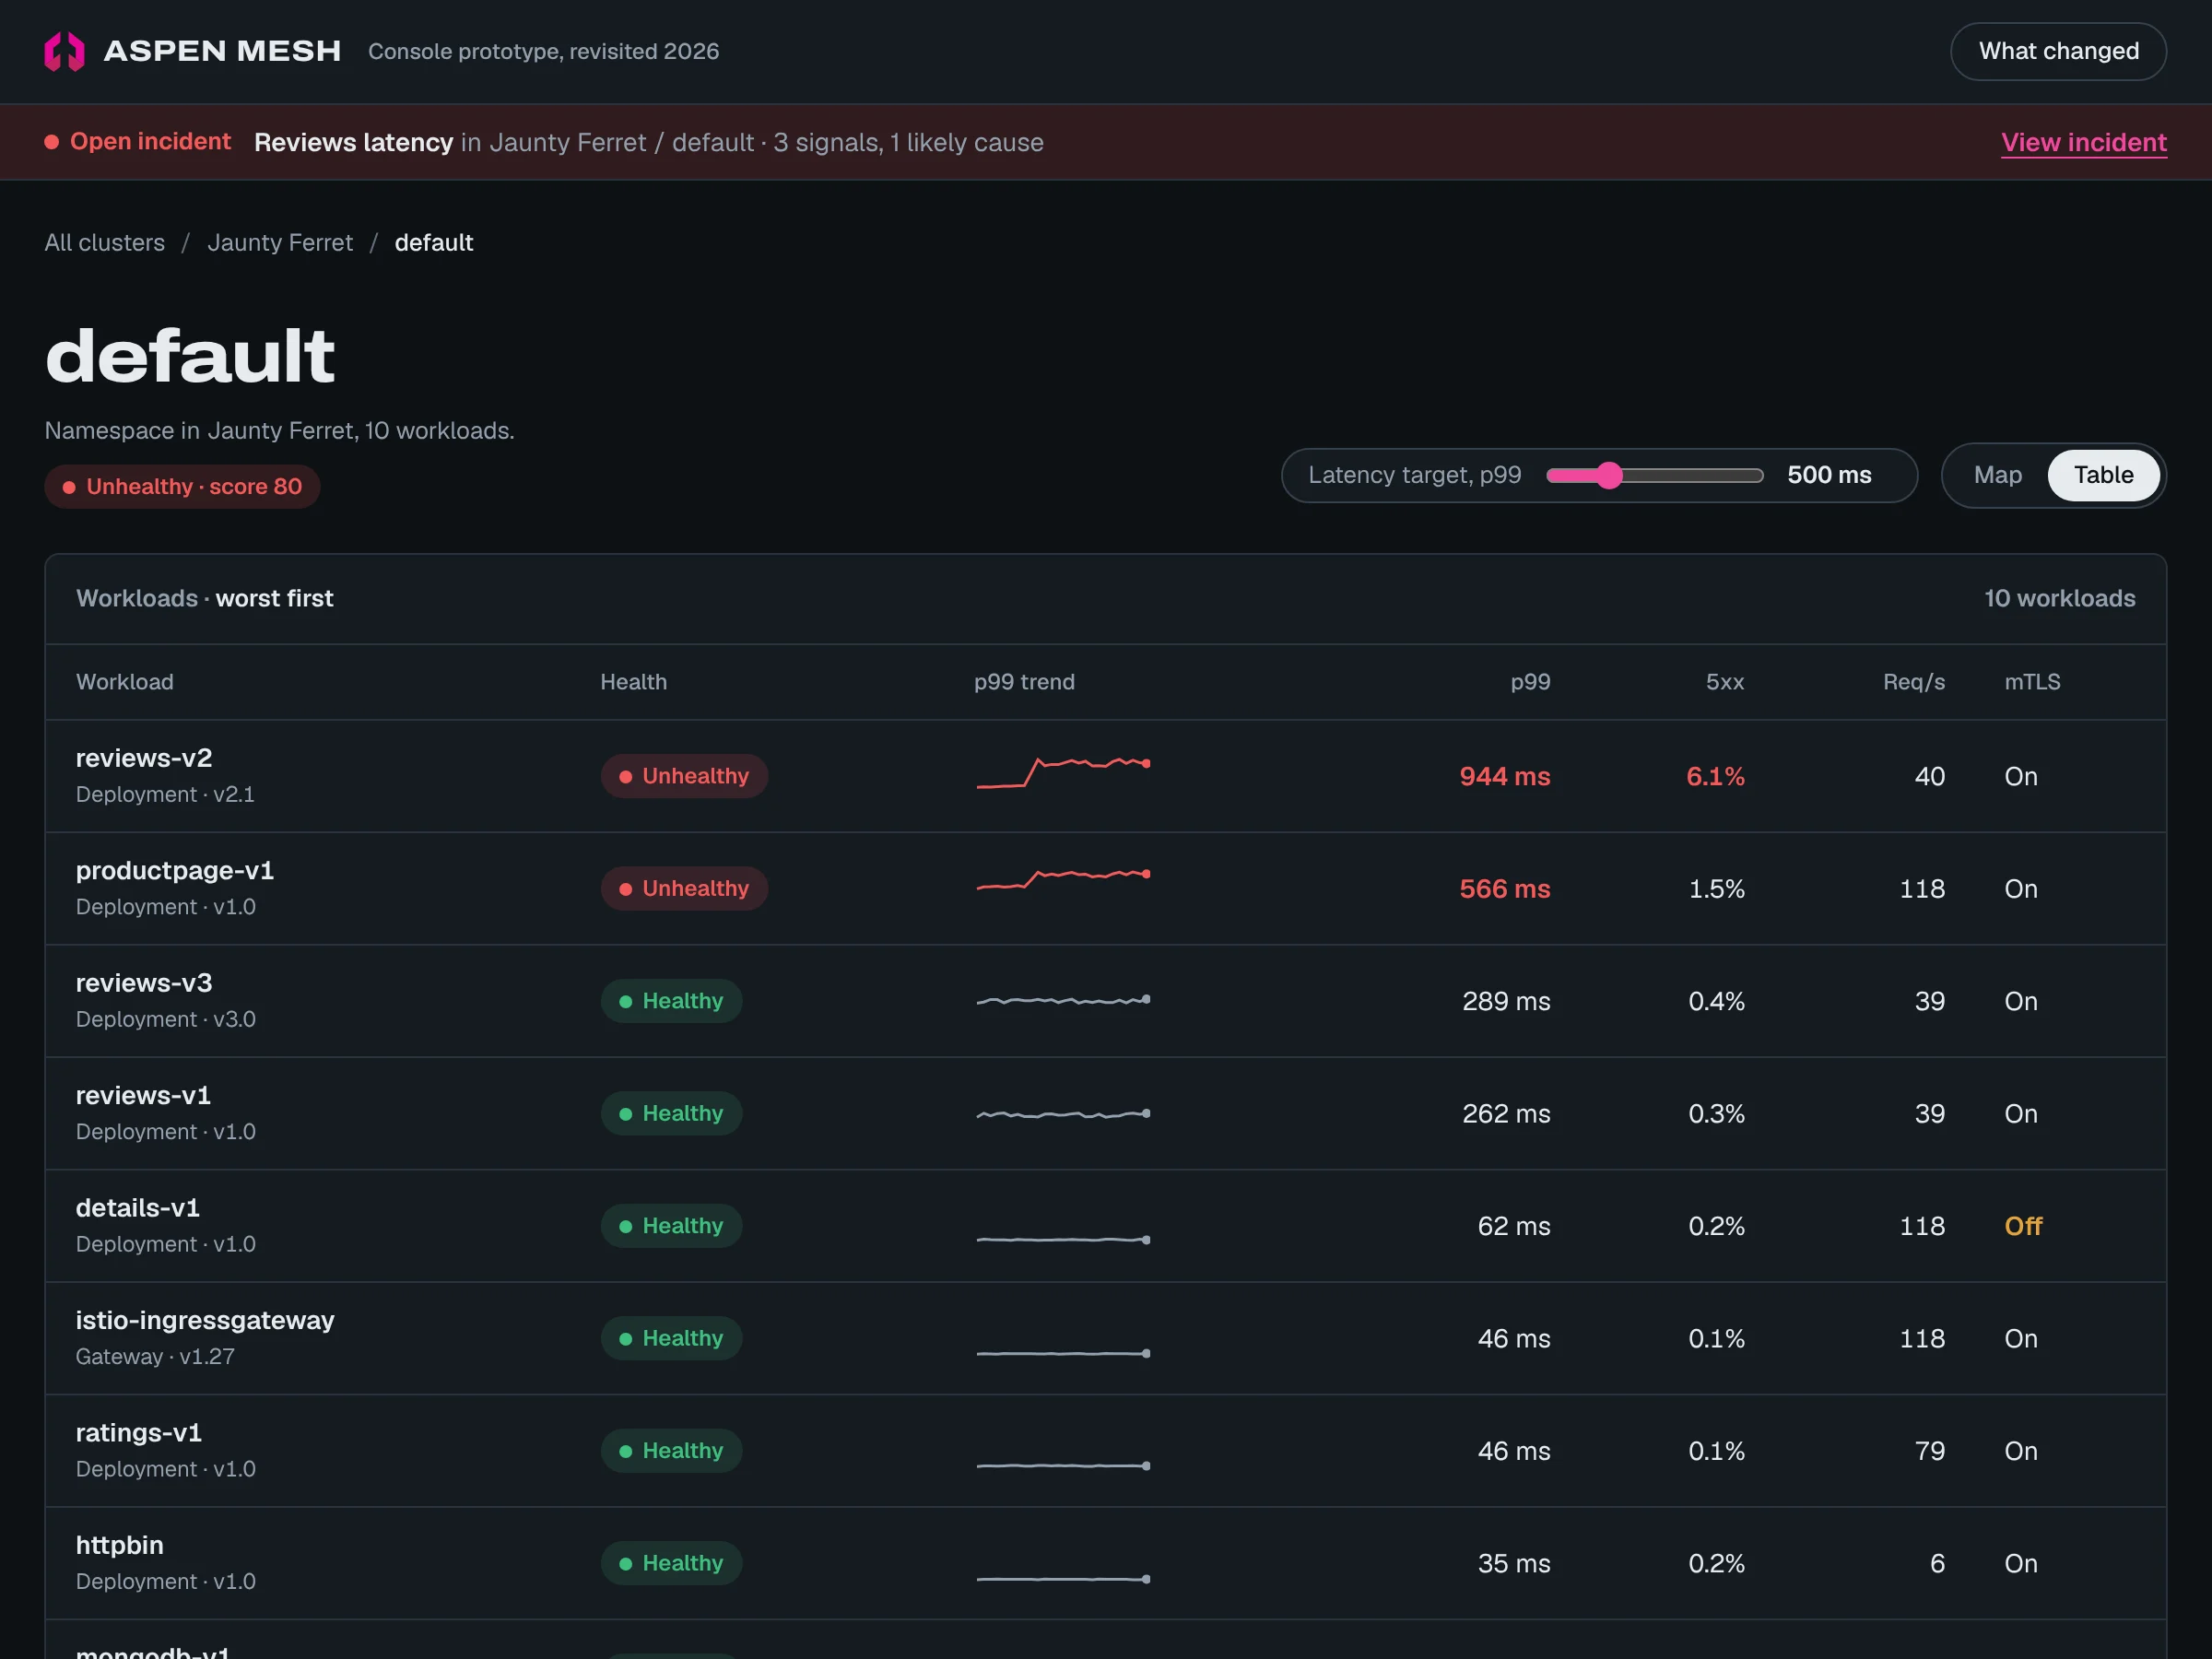
In 2026 I rebuilt the 2019 prototype as a single-page demo to see how its ideas hold up against what incident tooling looks like now.

The hierarchy stayed. What changed is how it handles an incident: in 2019 the alert listed the likely rollout first; in 2026 related alerts merge into one incident, and the fix is offered in the same panel, shown at the top of this page.
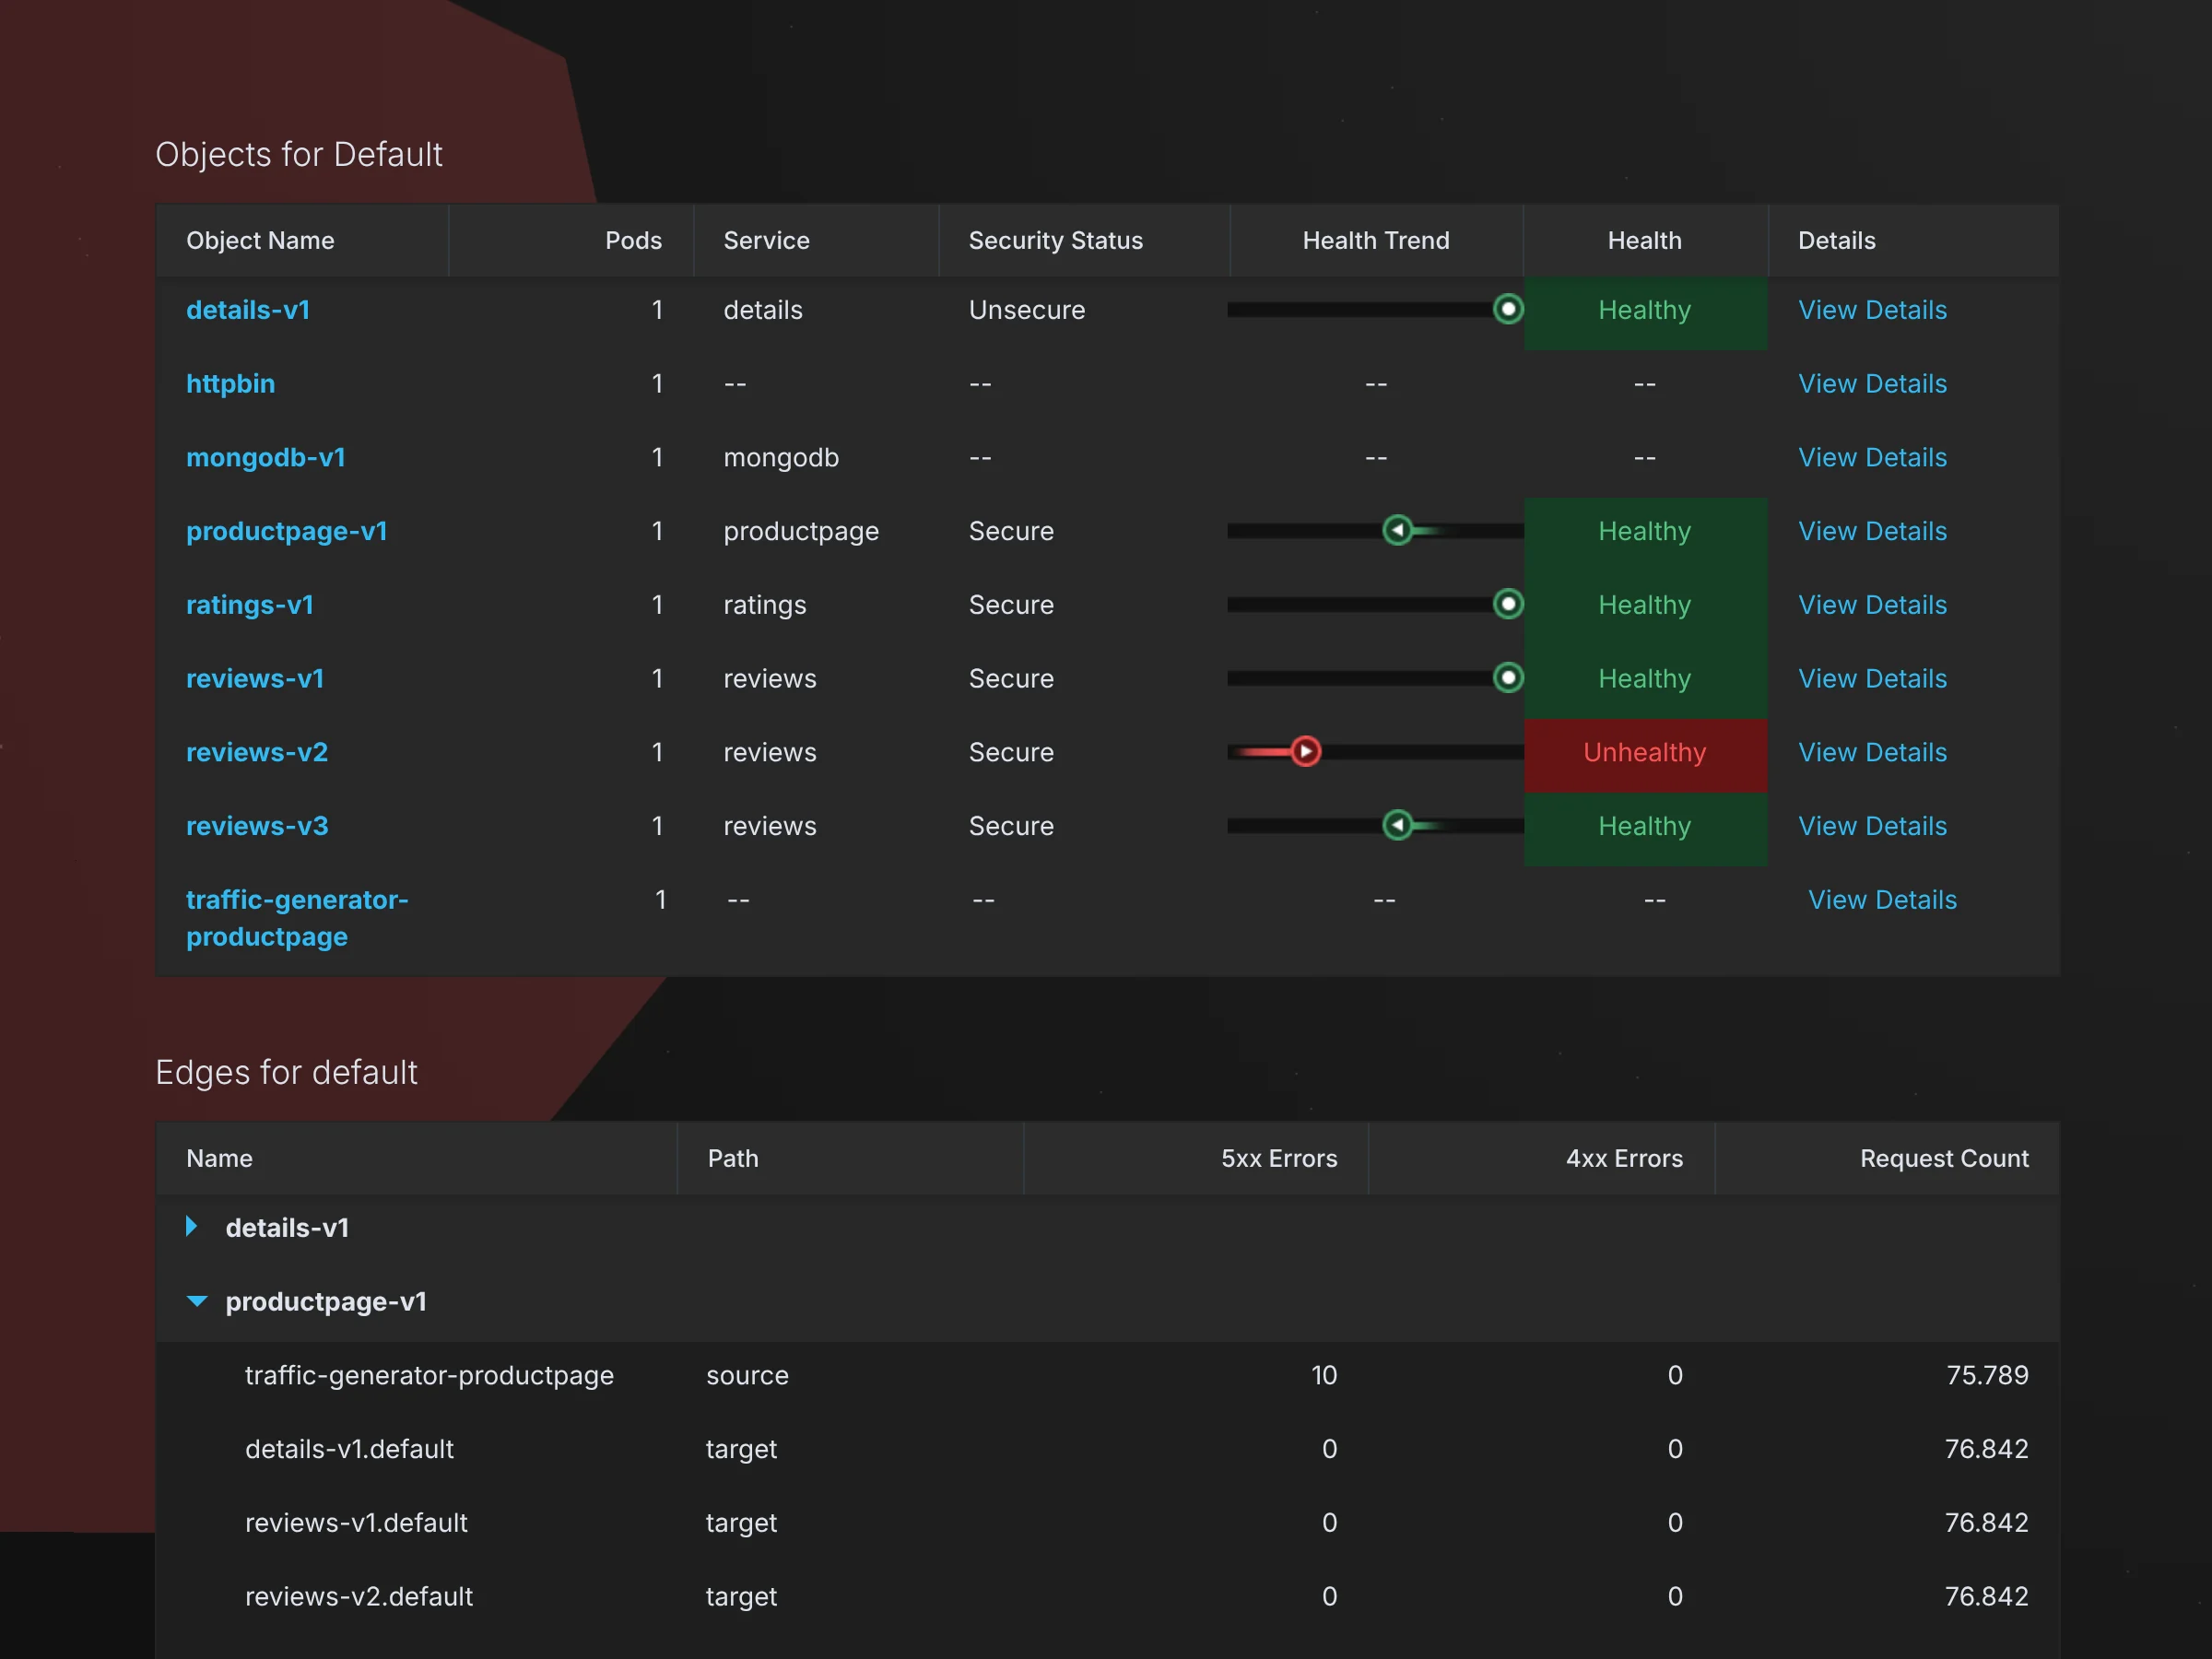
2019 namespace table listing workloads alphabetically.2019
2019. Workloads listed alphabetically, with a health-trend indicator.
2026 namespace table listing workloads worst first, with p99 sparklines, error rates and mTLS status.2026
2026. Worst first, with a p99 sparkline for every workload.
Open the live demo

What carried forward

The same drill-down habit shows up in my later work on the Cloudflare Workers dashboard and on operator interfaces at SMX. Find the unhealthy thing first, then make the path to its cause short.